See the crash.
Not just the Stack Trace.
Full-screen session recording, pinned to every stack trace. Four lines of setup. Zero frame drops on your app.
Stack Trace
First seen: Apr 6, 2026, 10:17 AM · Last seen: Apr 10, 2026, 1:53 AM · Total occurrences: 23 · Platform: Flutter 3.27.1
Same crash reporting. Full replay. Free forever.
Same error grouping, same impact ranking, same alerts you’d expect from Sentry, with the full replay included on the free tier. No per-replay billing.
What you get
10,000
Free foreverreplays per month.
- 1 replay = 1 crash clip, up to 10 seconds
- Retained for 30 days
- No credit card required
Press play on the moment it broke.
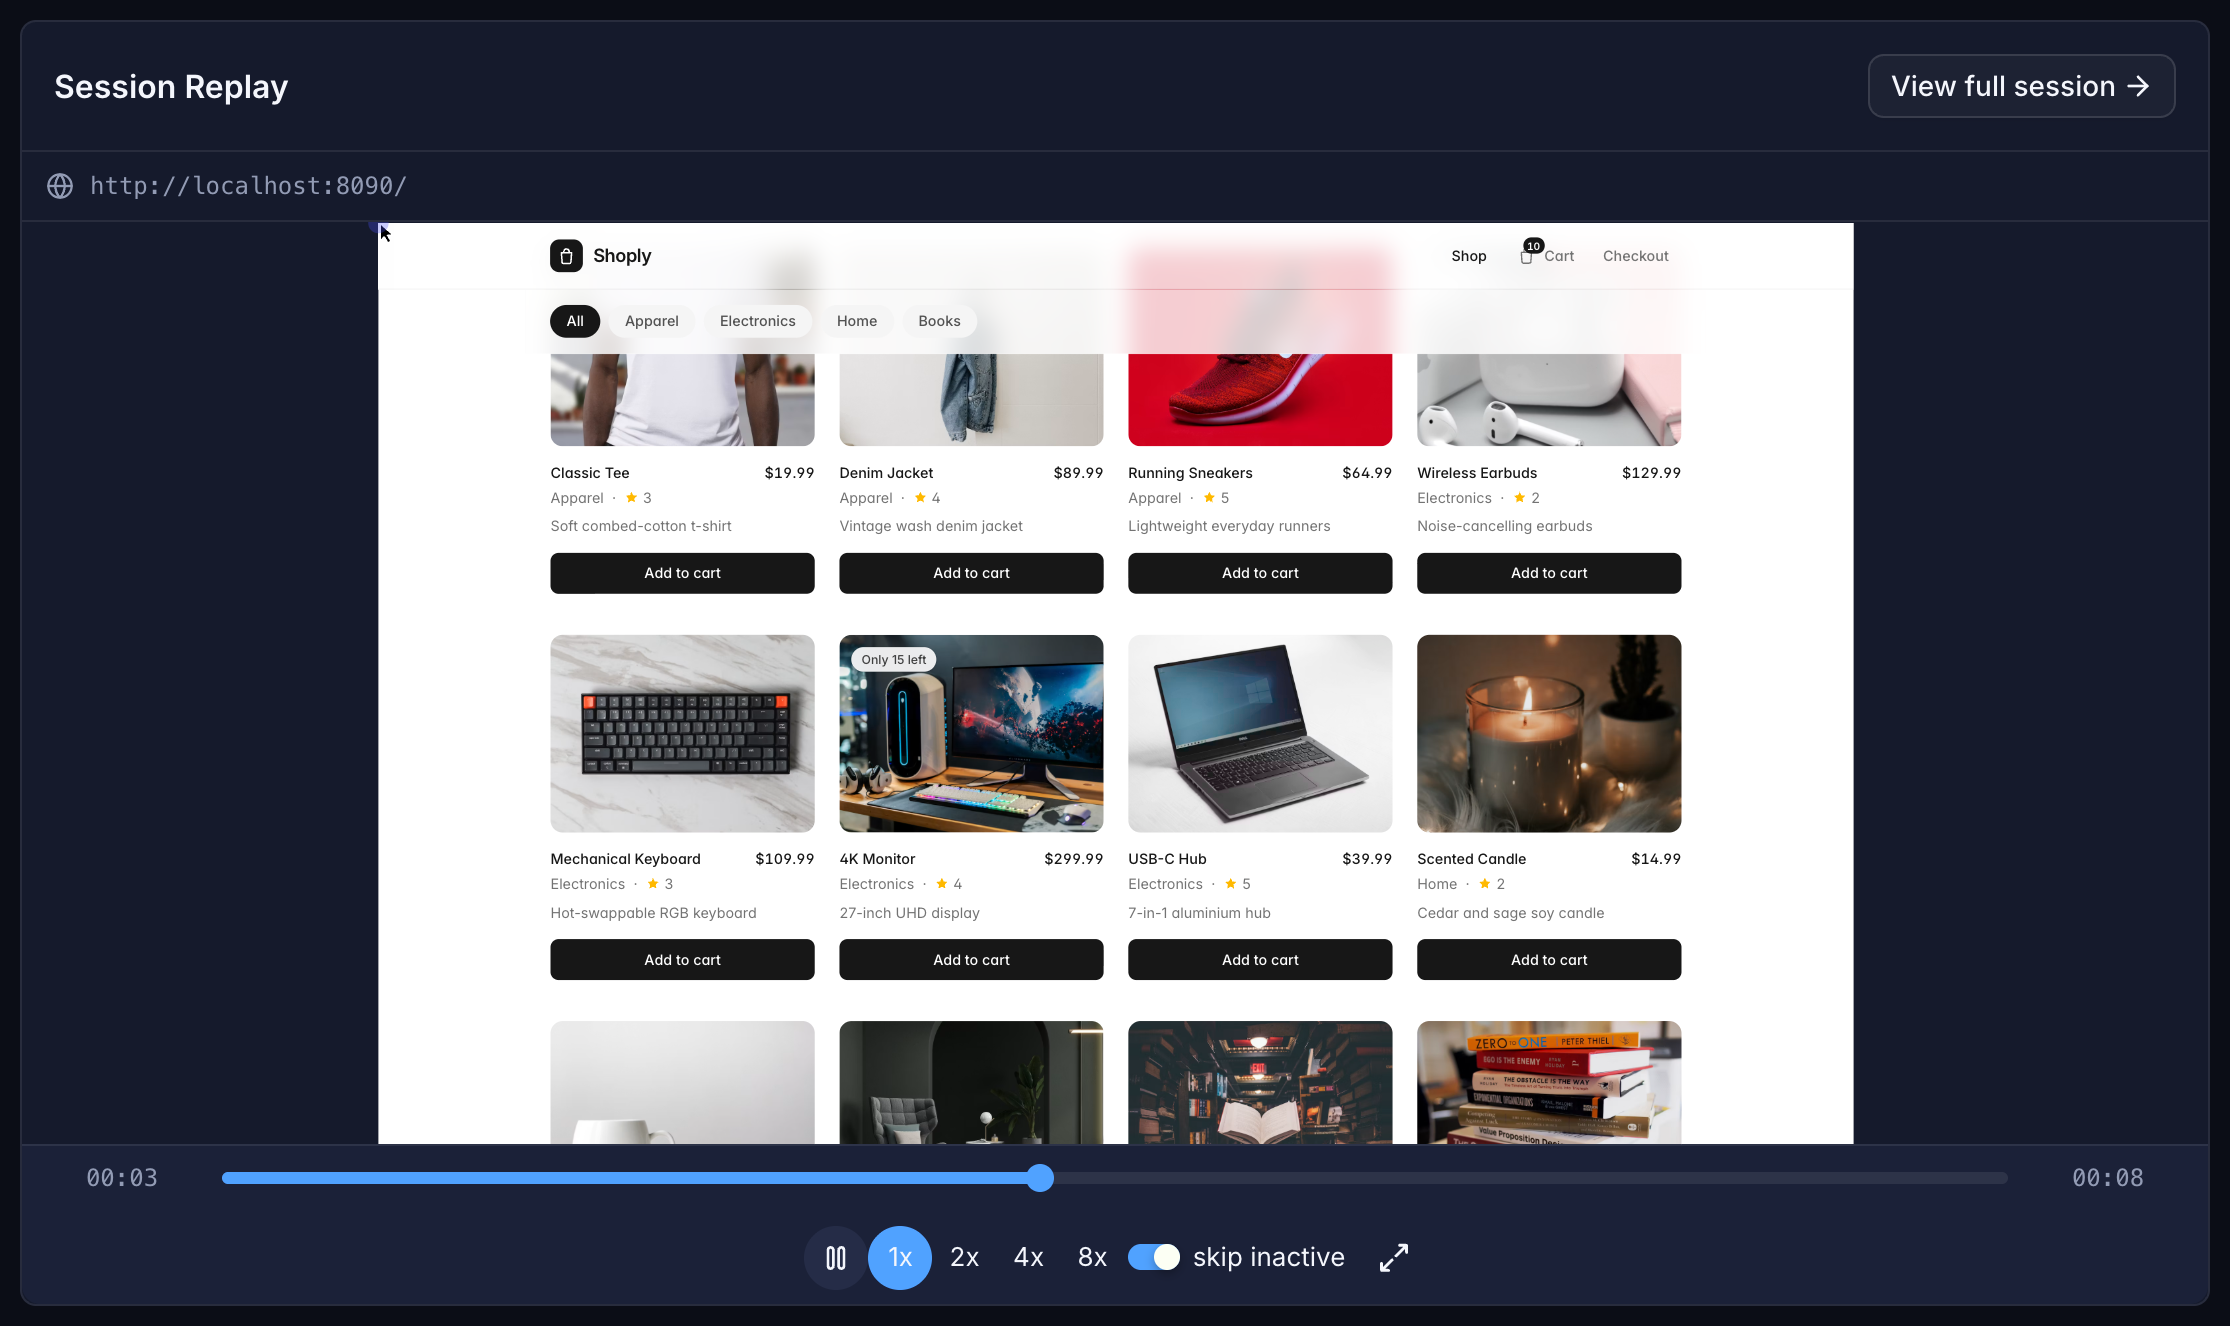
Every exception in the TracePath dashboard carries its replay. Open the stack trace, press play, and watch the last seconds of your user's session leading up to the crash, synced to the timeline.
- Scrub through the full session timeline
- Replay ID linked from every stack trace
- Tap, route, network, and console overlays
- Share a single URL with your team
Paste four lines. Ship.
Recording starts on the first frame. Every exception carries the replay ID automatically. Sensitive widgets are masked by default. Wrap anything extra in TracePathMask.
// flutter pub add tracepath to install.
A video is the start. The context is the rest.
Every replay carries the surrounding signal, so you don't just watch what happened, you see why.
Taps & gestures
Every tap and gesture rendered onto the recording, frame-synced with the last 10 seconds before the crash.
Console logs
Every print and debugPrint from the last 10 seconds, captured via a Zone hook with no manual wiring. Capped at 200 lines.
HTTP requests
Method, URL, status, duration, and byte counts for every dart:io HTTP call. Catches package:http, Dio, Firebase, and anything on the platform client.
Navigation timeline
Every push, pop, and replace from any Navigator. Attach TracePath.navigatorObserver once and the route history rides with every crash.
Custom actions
Tag your own breadcrumbs like cart.add_item and auth.login_succeeded with TracePath.recordAction. Capped at 200 entries.
Full stack trace
Caught FlutterErrors and uncaught async exceptions, symbolicated and stitched to the same timeline as the replay.
No frame drops. No battery spike.
Benchmarked on Pixel 5/6/8 and iPhone 8/14 Pro/16 Pro via Firebase Test Lab: 10 workloads × 4 SDK configs per device. Full harness open source; re-run it on your own tier. Tail latencies included because p50 is where bugs hide.
What we guarantee
- Idle is free. With
screenCapture: falseor before the first recording, RSS overhead stays under 10 MB on every tested device, and is typically zero. - Active recording stays small. Median memory overhead during capture is under 20 MB; the worst measured case across all devices held below 80 MB even under bursty video + exception workloads.
- Exception capture beats a frame. Sub-millisecond on iOS, under 15 ms on Android. Both fit inside a single 60 Hz frame (16.7 ms), so capturing an exception cannot drop a frame in steady state.
- Disk persistence is free. Writing recordings to disk consumes the same RAM as in-memory only, with no extra cost for offline-safe shipping.
The fine print
- Numbers come from a single GitHub Actions run on Firebase Test Lab hardware. Methodology and raw data live in the SDK repo.
- Frame-timing carries enough variance per scenario that we don’t claim improvements; we claim "no measurable regression on any tested workload".
- Worst-case memory peaks come from synthetic burst tests (5 exceptions per second during video playback). Apps that throw 1–2 exceptions per session sit at the median.
- Run the benchmark yourself with Performance Benchmarks on your fork.
Read the SDK. Run the benchmarks. Self-host the server.
Every part of TracePath is open source: the Flutter SDK, the Go backend, the dashboard. Nothing about your crash data is a black box.
Ship it before your next release.
10,000 replays every month. Free. Forever. No card required. One crash clip = one replay, retained 30 days.