Ten projects. Sixty machines. One page.
Per-project dashboards stop working the moment you have more than a few. The organization overview sits above all of them: every instance reporting in, every issue, every monitor, and every page that still needs a human. Kubernetes nodes group by cluster, plain hosts sit alongside them, and one click lands you in the dashboard for the box that is actually on fire.
The fleet, as one heartbeat
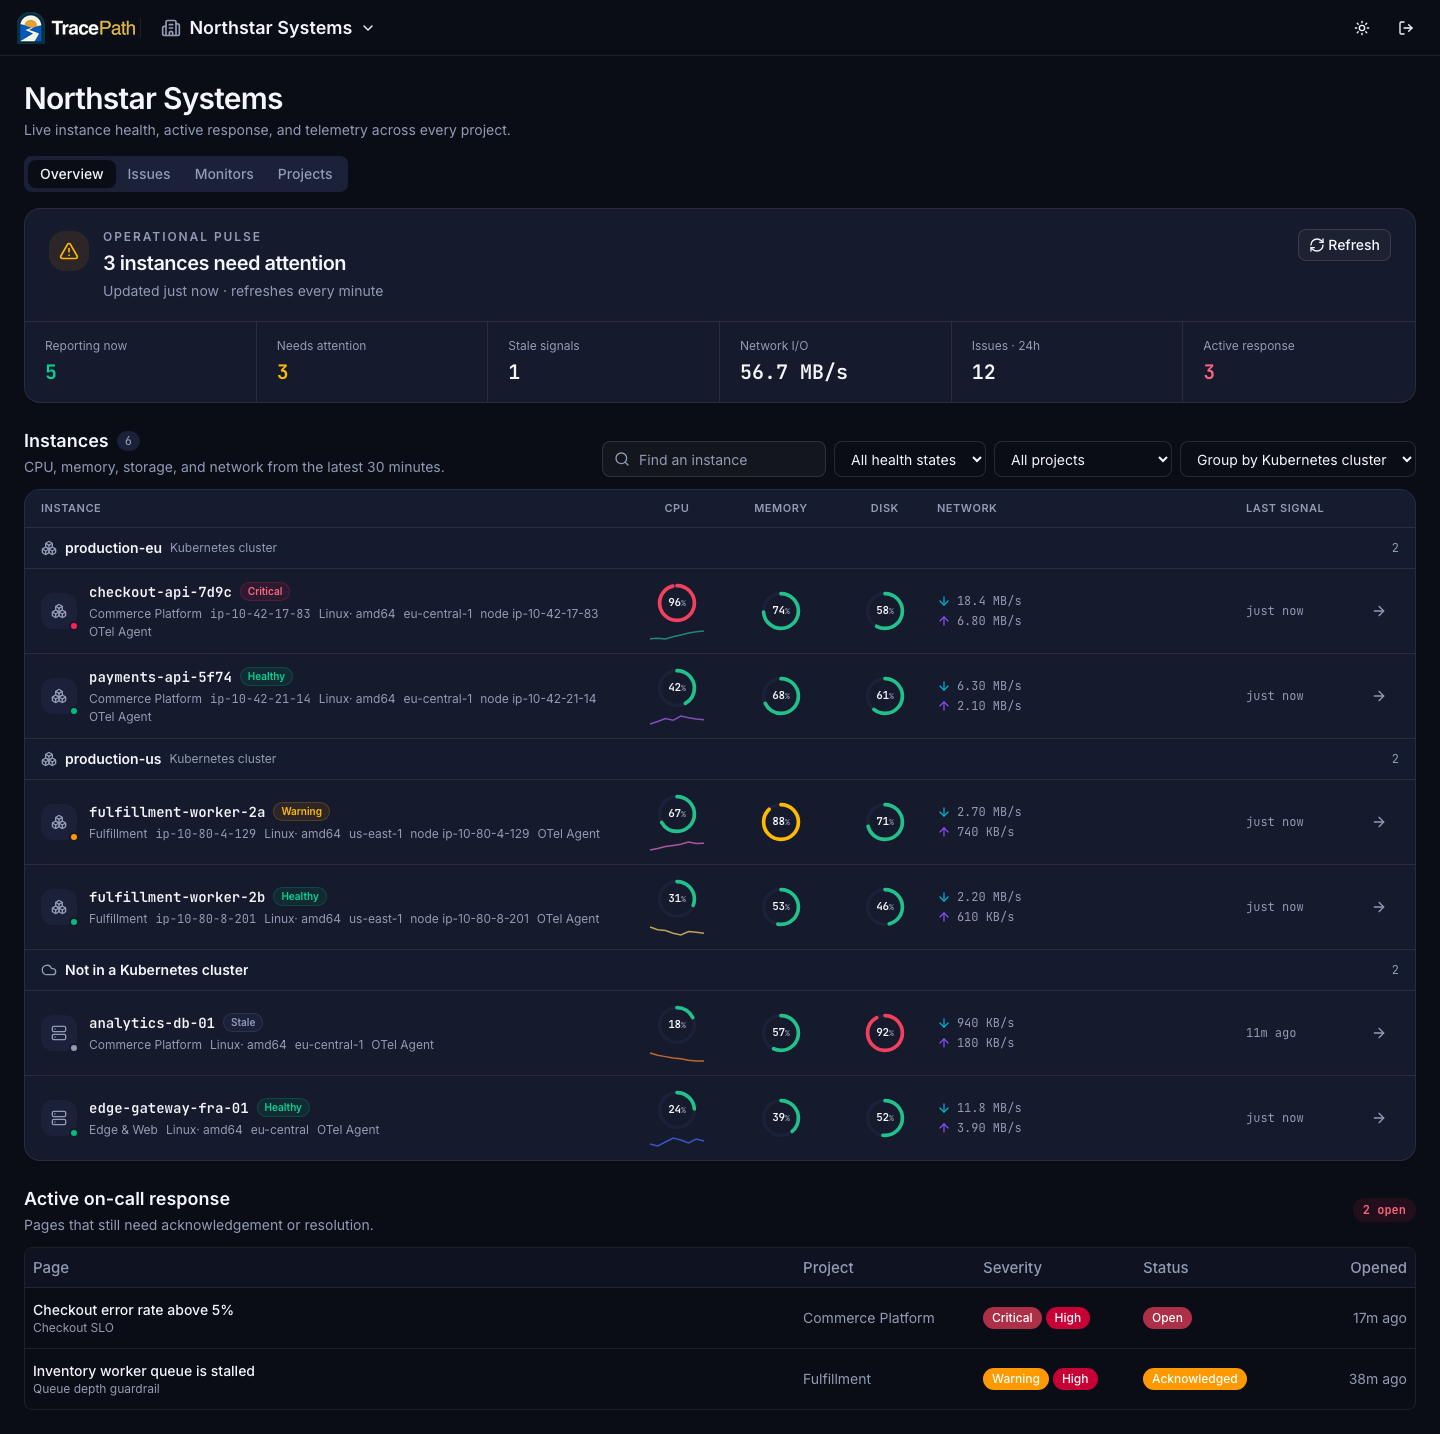
CPU, memory, disk, and network for every machine reporting into the organization, refreshed every minute. Rows sort worst-first, and stale outranks warning on purpose: a box that stopped talking is a bigger unknown than one running warm. Nothing to register and nothing to clean up, because an instance exists exactly as long as it reports.
- Critical, warning, stale, and healthy computed from live metrics
- One counter each for reporting, needs attention, stale, and network I/O
- Issues in 24h and open on-call pages across every project
- Search by host, OS, architecture, cloud region, cluster, or node
A whole cluster, in one apply
Two OpenTelemetry Collector workloads cover everything: a DaemonSet for node health, pod resource usage, and container logs, and one small Deployment for cluster state and Kubernetes events. Every node becomes an instance row, grouped under your cluster name. Half-migrated fleets still read as one fleet, because plain hosts sit in the same table.
- Node CPU, memory, disk, and network per node
- Pod metrics, container stdout, cluster events
- Group and filter by cluster, namespace, node, deployment
- Optional in-cluster gateway so the token lives in one Secret
Uptime and incidents, without the project hop
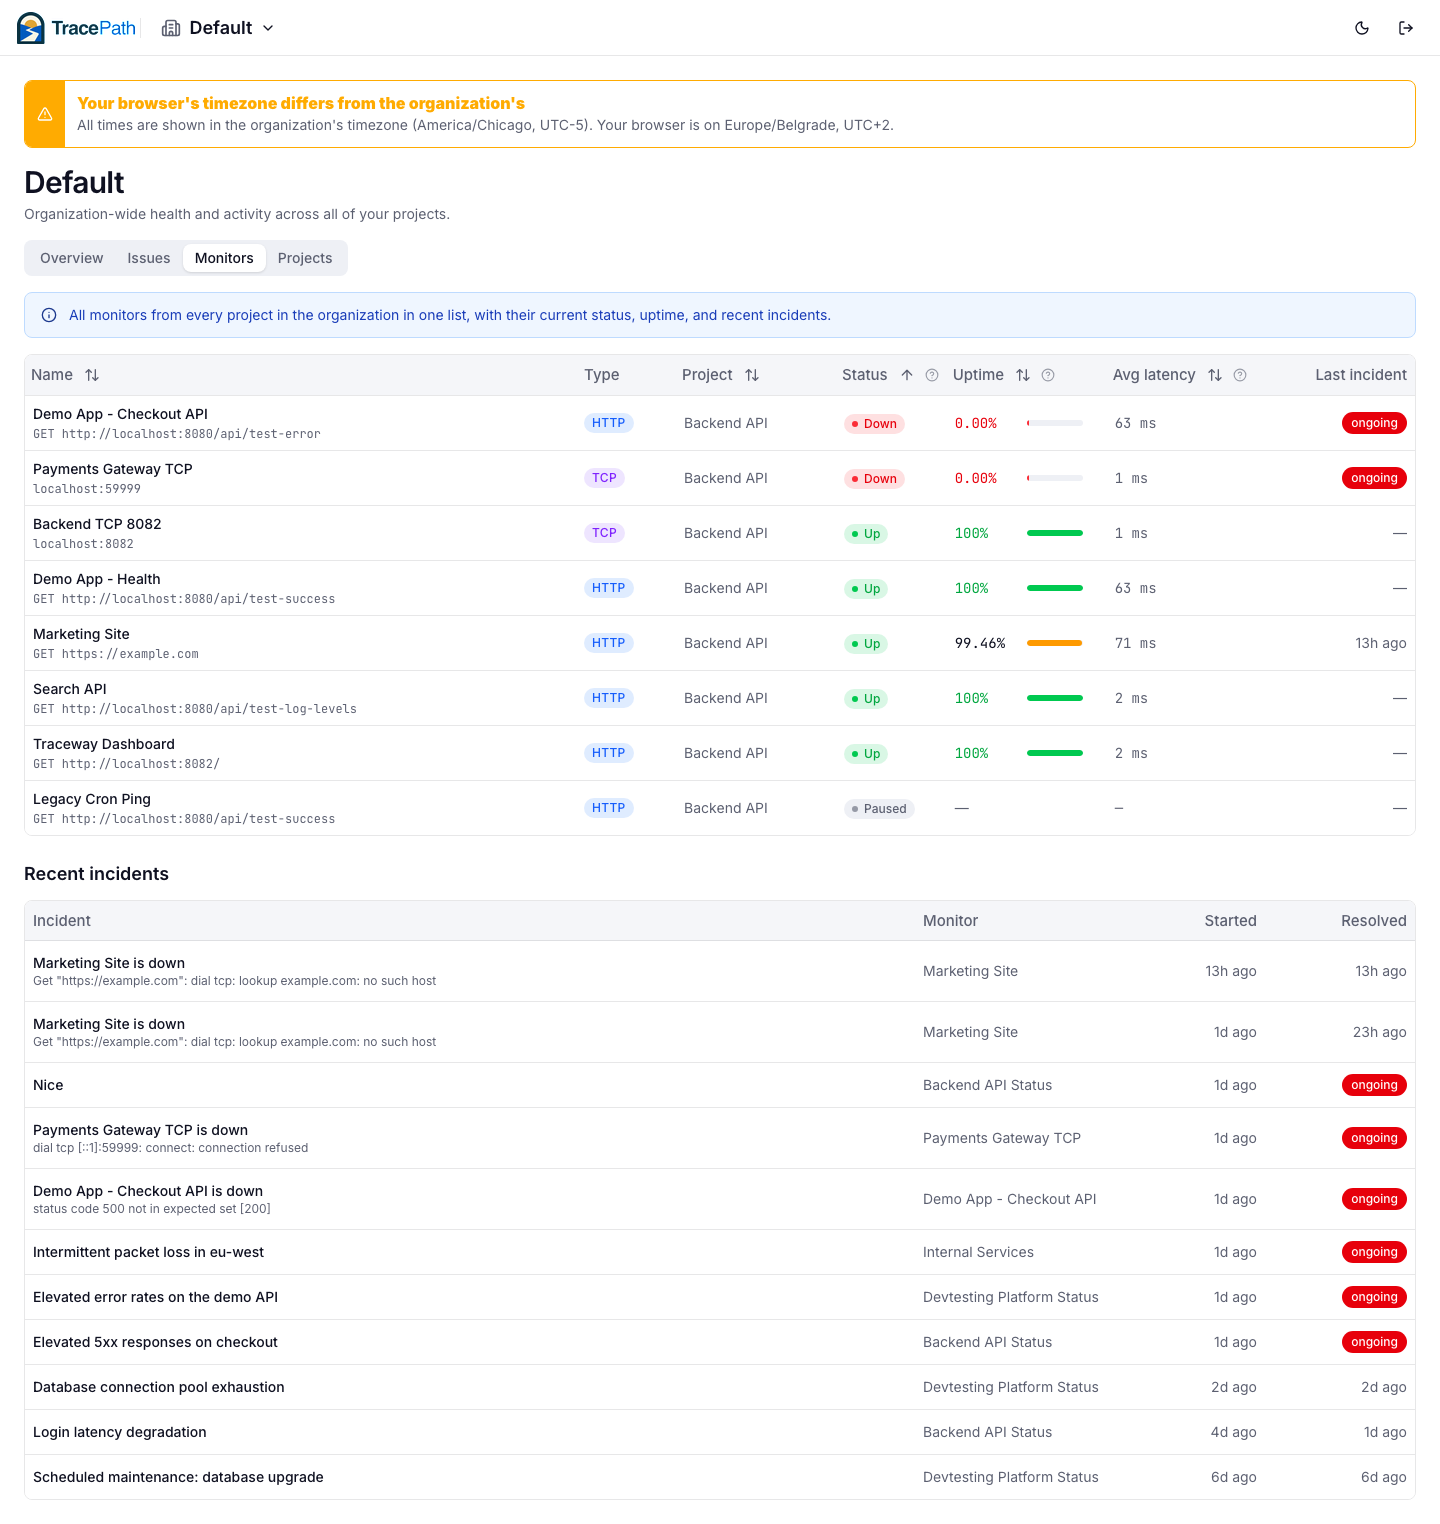
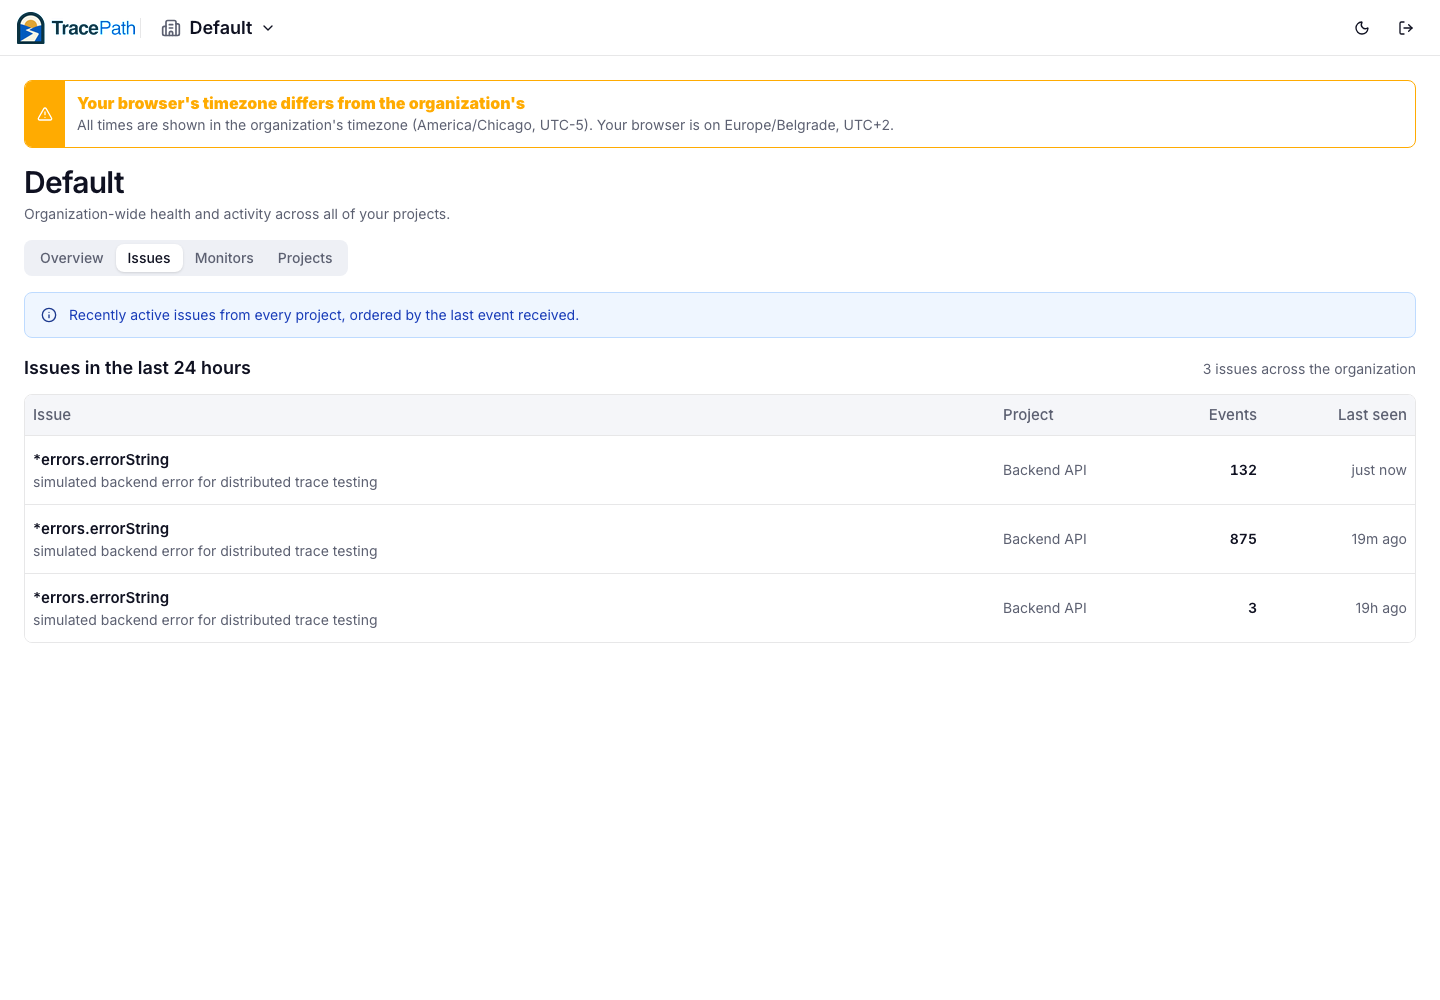
Every monitor in the organization in one sortable list with its project, status, 30-day uptime, and average latency, over the organization's whole incident history. The Issues tab does the same for exceptions: everything that fired in the last 24 hours, newest first, labelled with the project that owns it. Triage first, drill in second.
- Monitors, uptime, latency, and last incident across all projects
- 90 days of incident history, ongoing ones marked
- Recently active issues from every project in one feed
- Uptime excludes missed probes, so downtime never reads as 100%
One switcher for everything you can see
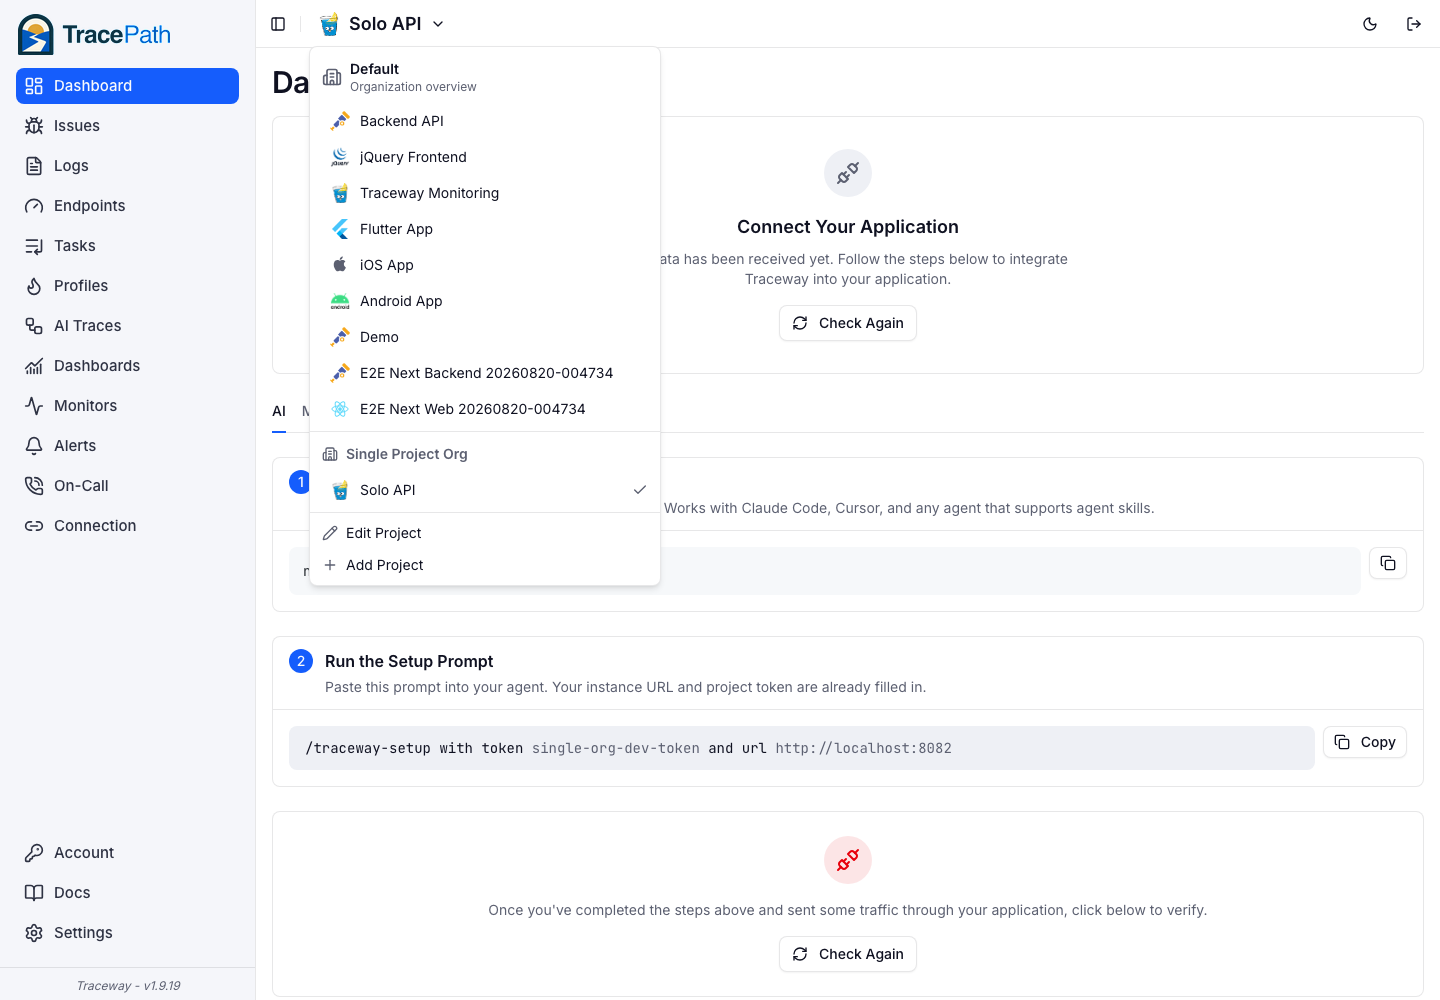
Projects are the isolation boundary for telemetry. Organizations own everything above them: members and roles, dashboards, teams, on-call rotations, escalation policies, and status pages. Belong to several and each keeps its own overview, which is what makes an organization the right shape for an agency's clients or a company's independent units.
- Organizations as headings, their projects nested underneath
- Every organization member can read the overview, read-only included
- Per-project role overrides shown as your effective access
- Sign in and land on the overview when you have more than one project
Click a row, land on the answer
Selecting an instance opens its project's dashboards already filtered to that one machine over the last 30 minutes, on the server dashboard if the project has one installed. The scope is a URL parameter, so the filtered view is shareable and survives every time-range change you make while digging.
- Instance picker lists what actually reported in the range
- Applies on top of each widget's own filters, saves nothing
- Open on-call pages link straight to the page that fired
- Issue rows link to the exception in its own project
Stop opening ten dashboards
Fleet health, cross-project triage, Kubernetes, and on-call in the same tool that already holds your traces, logs, and errors. Open source if you self-host.
Questions about fleets and clusters
What counts as an instance?
Anything reporting server metrics under its own service.name, which TracePath stores as the server_name tag. A VM with the OTel Agent, a bare-metal box, a Kubernetes node. Instances are discovered from the metrics themselves, so there is nothing to register and nothing to delete when a machine goes away.
Are pods instances?
No, nodes are. A pod moves, restarts, and gets a new name on every rollout, so a per-pod instance list would be noise. The node agent names each node, and pod identity lives on the metrics as k8s.pod.name, k8s.namespace.name, and k8s.deployment.name, which you group dashboards by. Applications keep their own service.name, so an API stays one service in Endpoints and Issues no matter which node it lands on.
Can one organization hold several clusters?
Yes, and several clusters can even share one project. Each cluster reports its own k8s.cluster.name, and the overview groups instances by it. Machines with no cluster attribute collect under "Not in a Kubernetes cluster", so a migration in progress still shows as one fleet rather than two tools.
Do I need the OTel Agent as well as the Kubernetes collectors?
Not on the same machine. The agent is a host service for VMs and bare metal; the DaemonSet covers nodes inside a cluster and reports the same hostmetrics, plus pod metrics, container logs, and cluster state. Most fleets run both, just not on the same box.
Does the overview leak data across teams?
No. It shows the organization's projects, which every member of that organization can already open, and it respects per-project role overrides: the Projects tab lists your effective access on each one. Read-only members can open it; it grants nothing they did not already have. Nothing is shared between separate organizations.
How current is it?
The instance table covers the last 30 minutes and the page refreshes itself every minute, with a manual refresh button. An instance is stale after three minutes of silence. A refresh that fails leaves the last good snapshot on screen with a warning instead of blanking the page, and one unreadable project never takes down the rest.
Is this a paid feature?
No. The organization overview and the Kubernetes manifests are part of self-hosted TracePath, which is fully open source, and part of every TracePath Cloud plan. Your plan sizes what you can send, not which views you get.