
Every signal, one backend. Built on OpenTelemetry.
Logs, traces, metrics, session replay and exceptions, connected to each other and priced so you can read the bill. Standard OTLP in, so your instrumentation is never locked to us.
Free plan, no credit card · See pricing
Your agents can fix production. Hand them the telemetry.
One command connects Claude Code, Cursor, or any MCP client to your instance. From there your agent queries exceptions, logs, traces and metrics itself — scoped to the user who approved the connection.

Your instrumentation stays yours.
TracePath speaks plain OTLP. You instrument with the OpenTelemetry SDKs and collectors you already know, and you change your mind later by editing one environment variable. No proprietary agent to rip out, no rewrite to leave.


Connected in 90 seconds flat.
Already emitting OpenTelemetry? Point the exporter at your ingest endpoint, add the project token as a bearer header, and the first trace lands before the page finishes loading.
Customers don't complain, they quit. We stop the bleeding.
TracePath catches the error, the session replay, and the exact failing span before your users close the tab.
01 · Detect
Surface what actually matters.
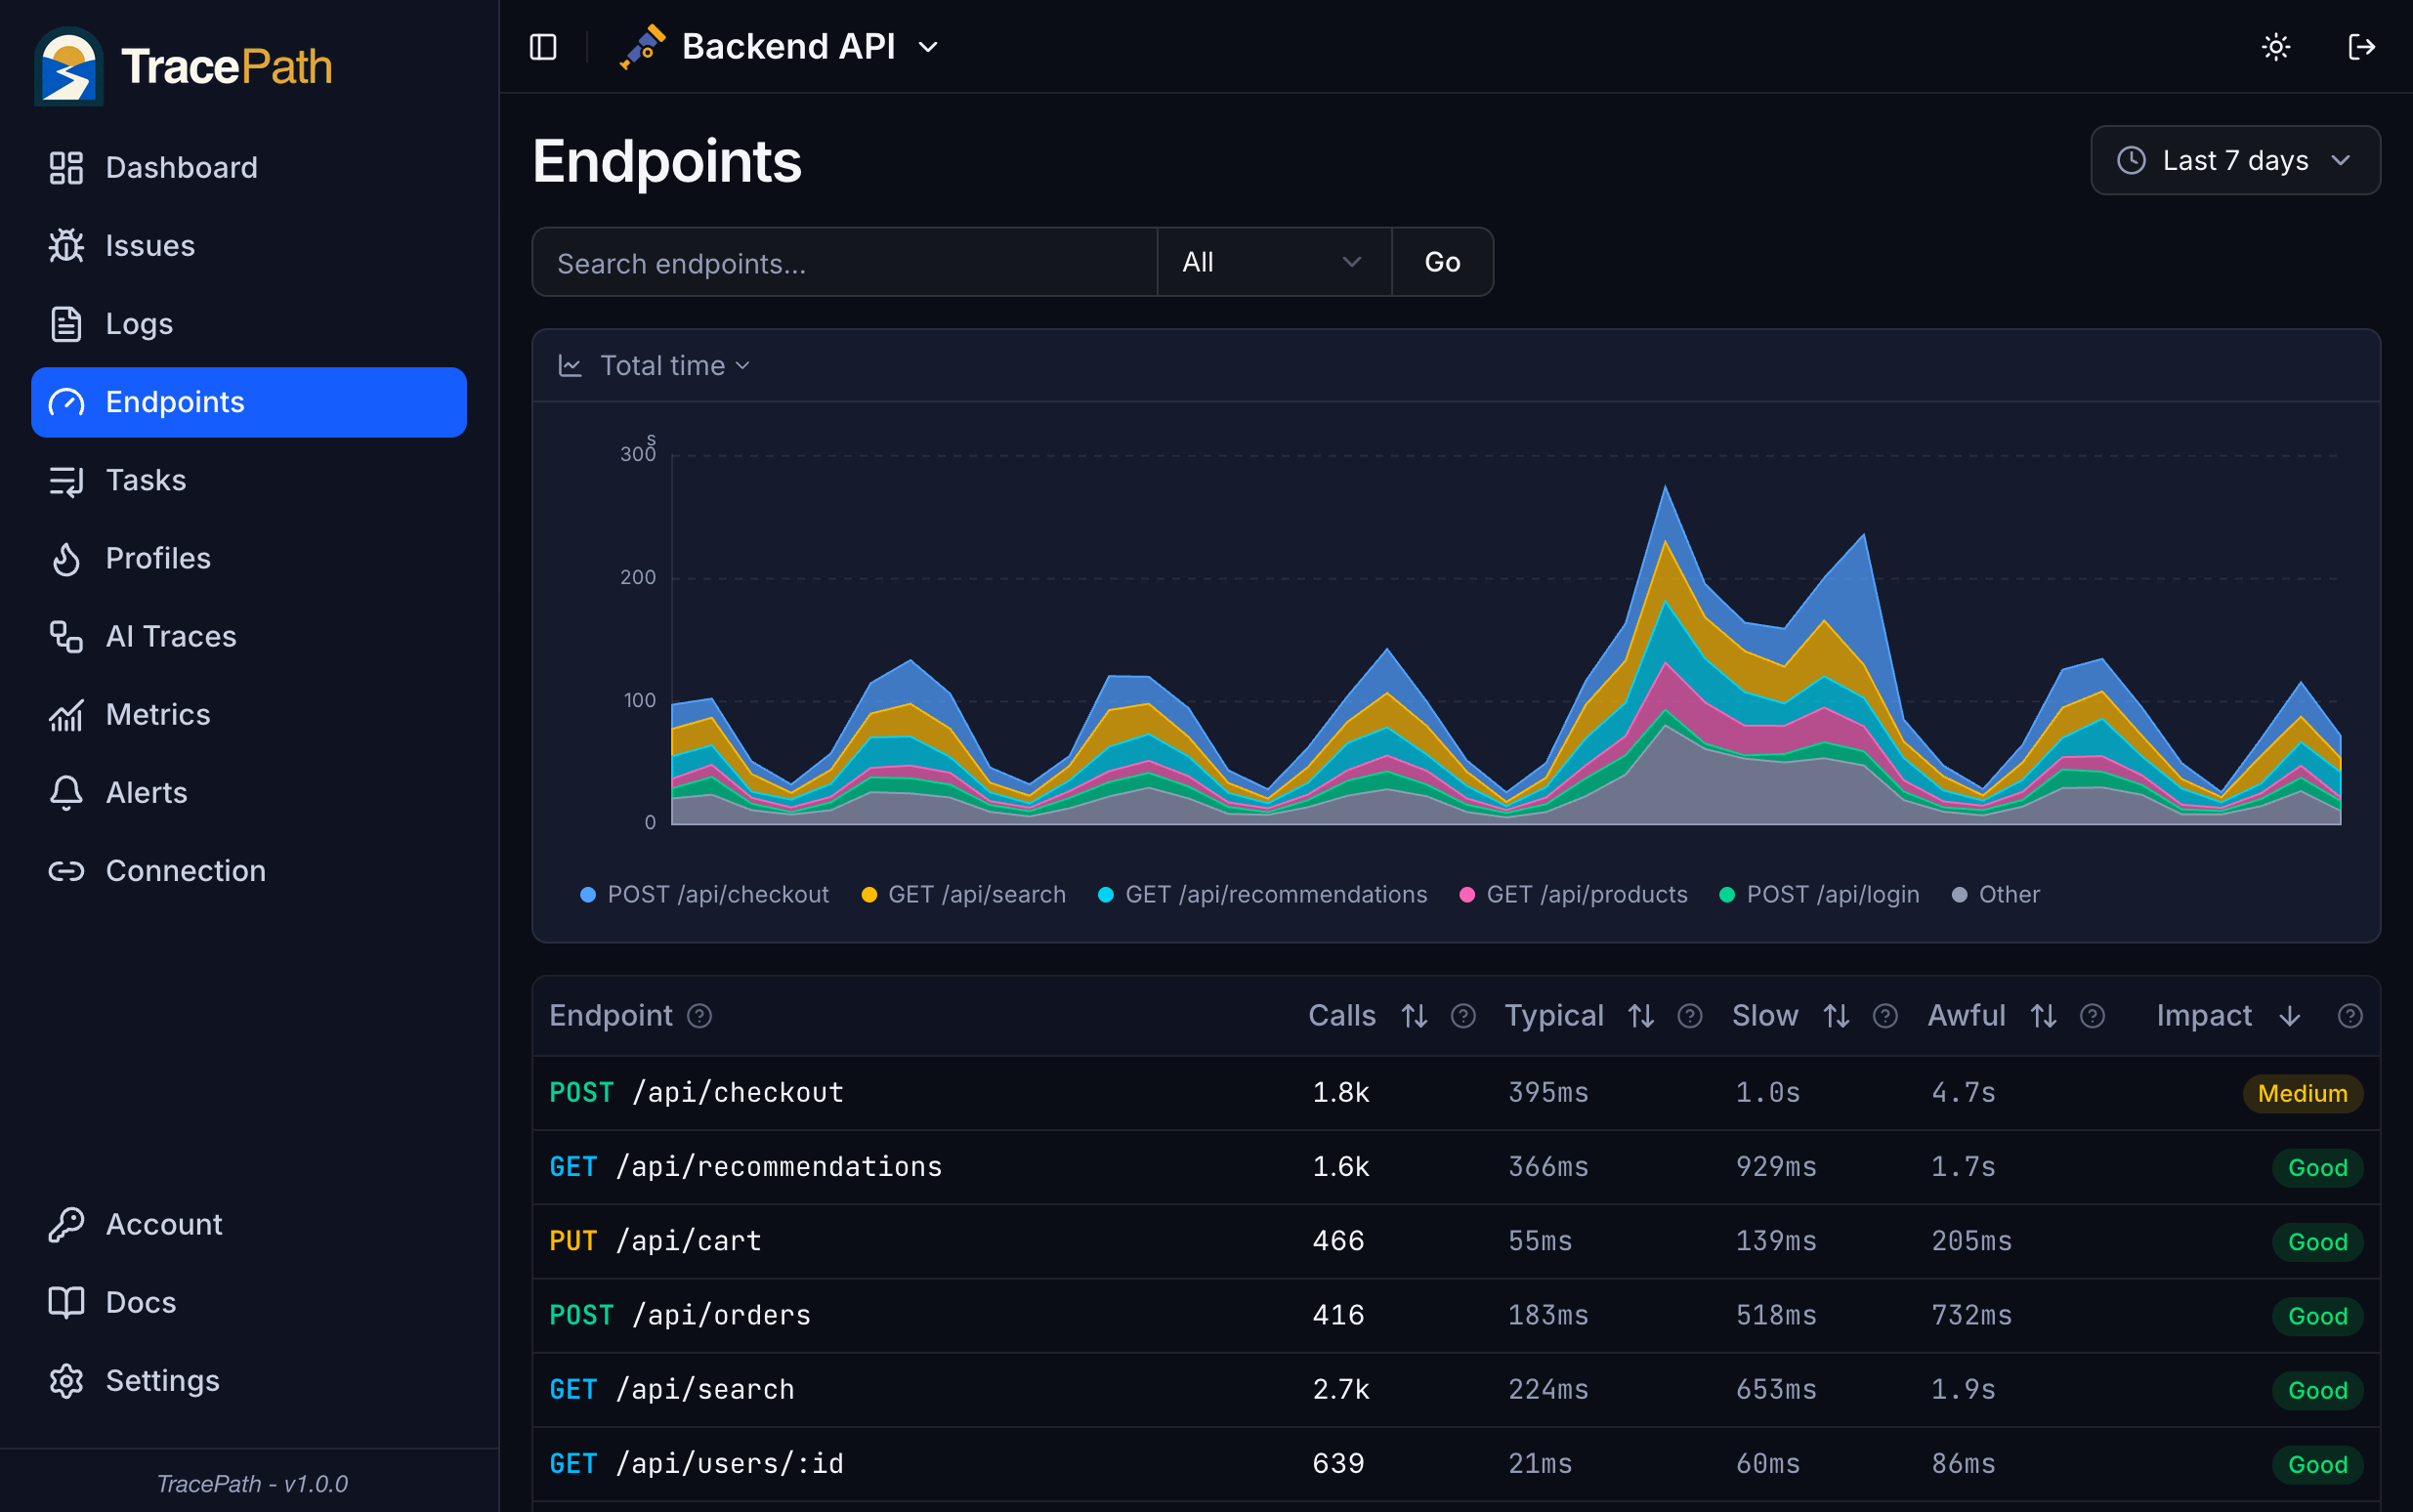
Impact Score ranks every endpoint by five service-level signals and routes alerts to Slack, email, or a webhook — or pages whoever is on call. No false-positive fatigue.
02 · Resolve
Walk the full trace. Fix. Ship.
Click an exception to see the session replay, the cross-service trace, and the source-mapped stack. Context-switching is the bug.
A flat monthly price. None of the asterisks.
Plans include their seats and their ingest allowance. Hit the allowance and we email you at 80% and pause ingest at 100% until the period resets or you upgrade — you are never billed for an overage you did not agree to.
Detect. Replay. Resolve.
Start on the free plan, no credit card. Get in touch if you'd like a walkthrough first.