Telemetry sees inside. Monitors check from outside.
Traces and logs only exist while requests arrive. A monitor keeps probing on a schedule, an HTTP request, a TCP connect, or a full Playwright browser flow, so you find out your site is down before a user tells you. In the same tool that already holds the stack trace.
An HTTP request, a TCP connect, or a real browser
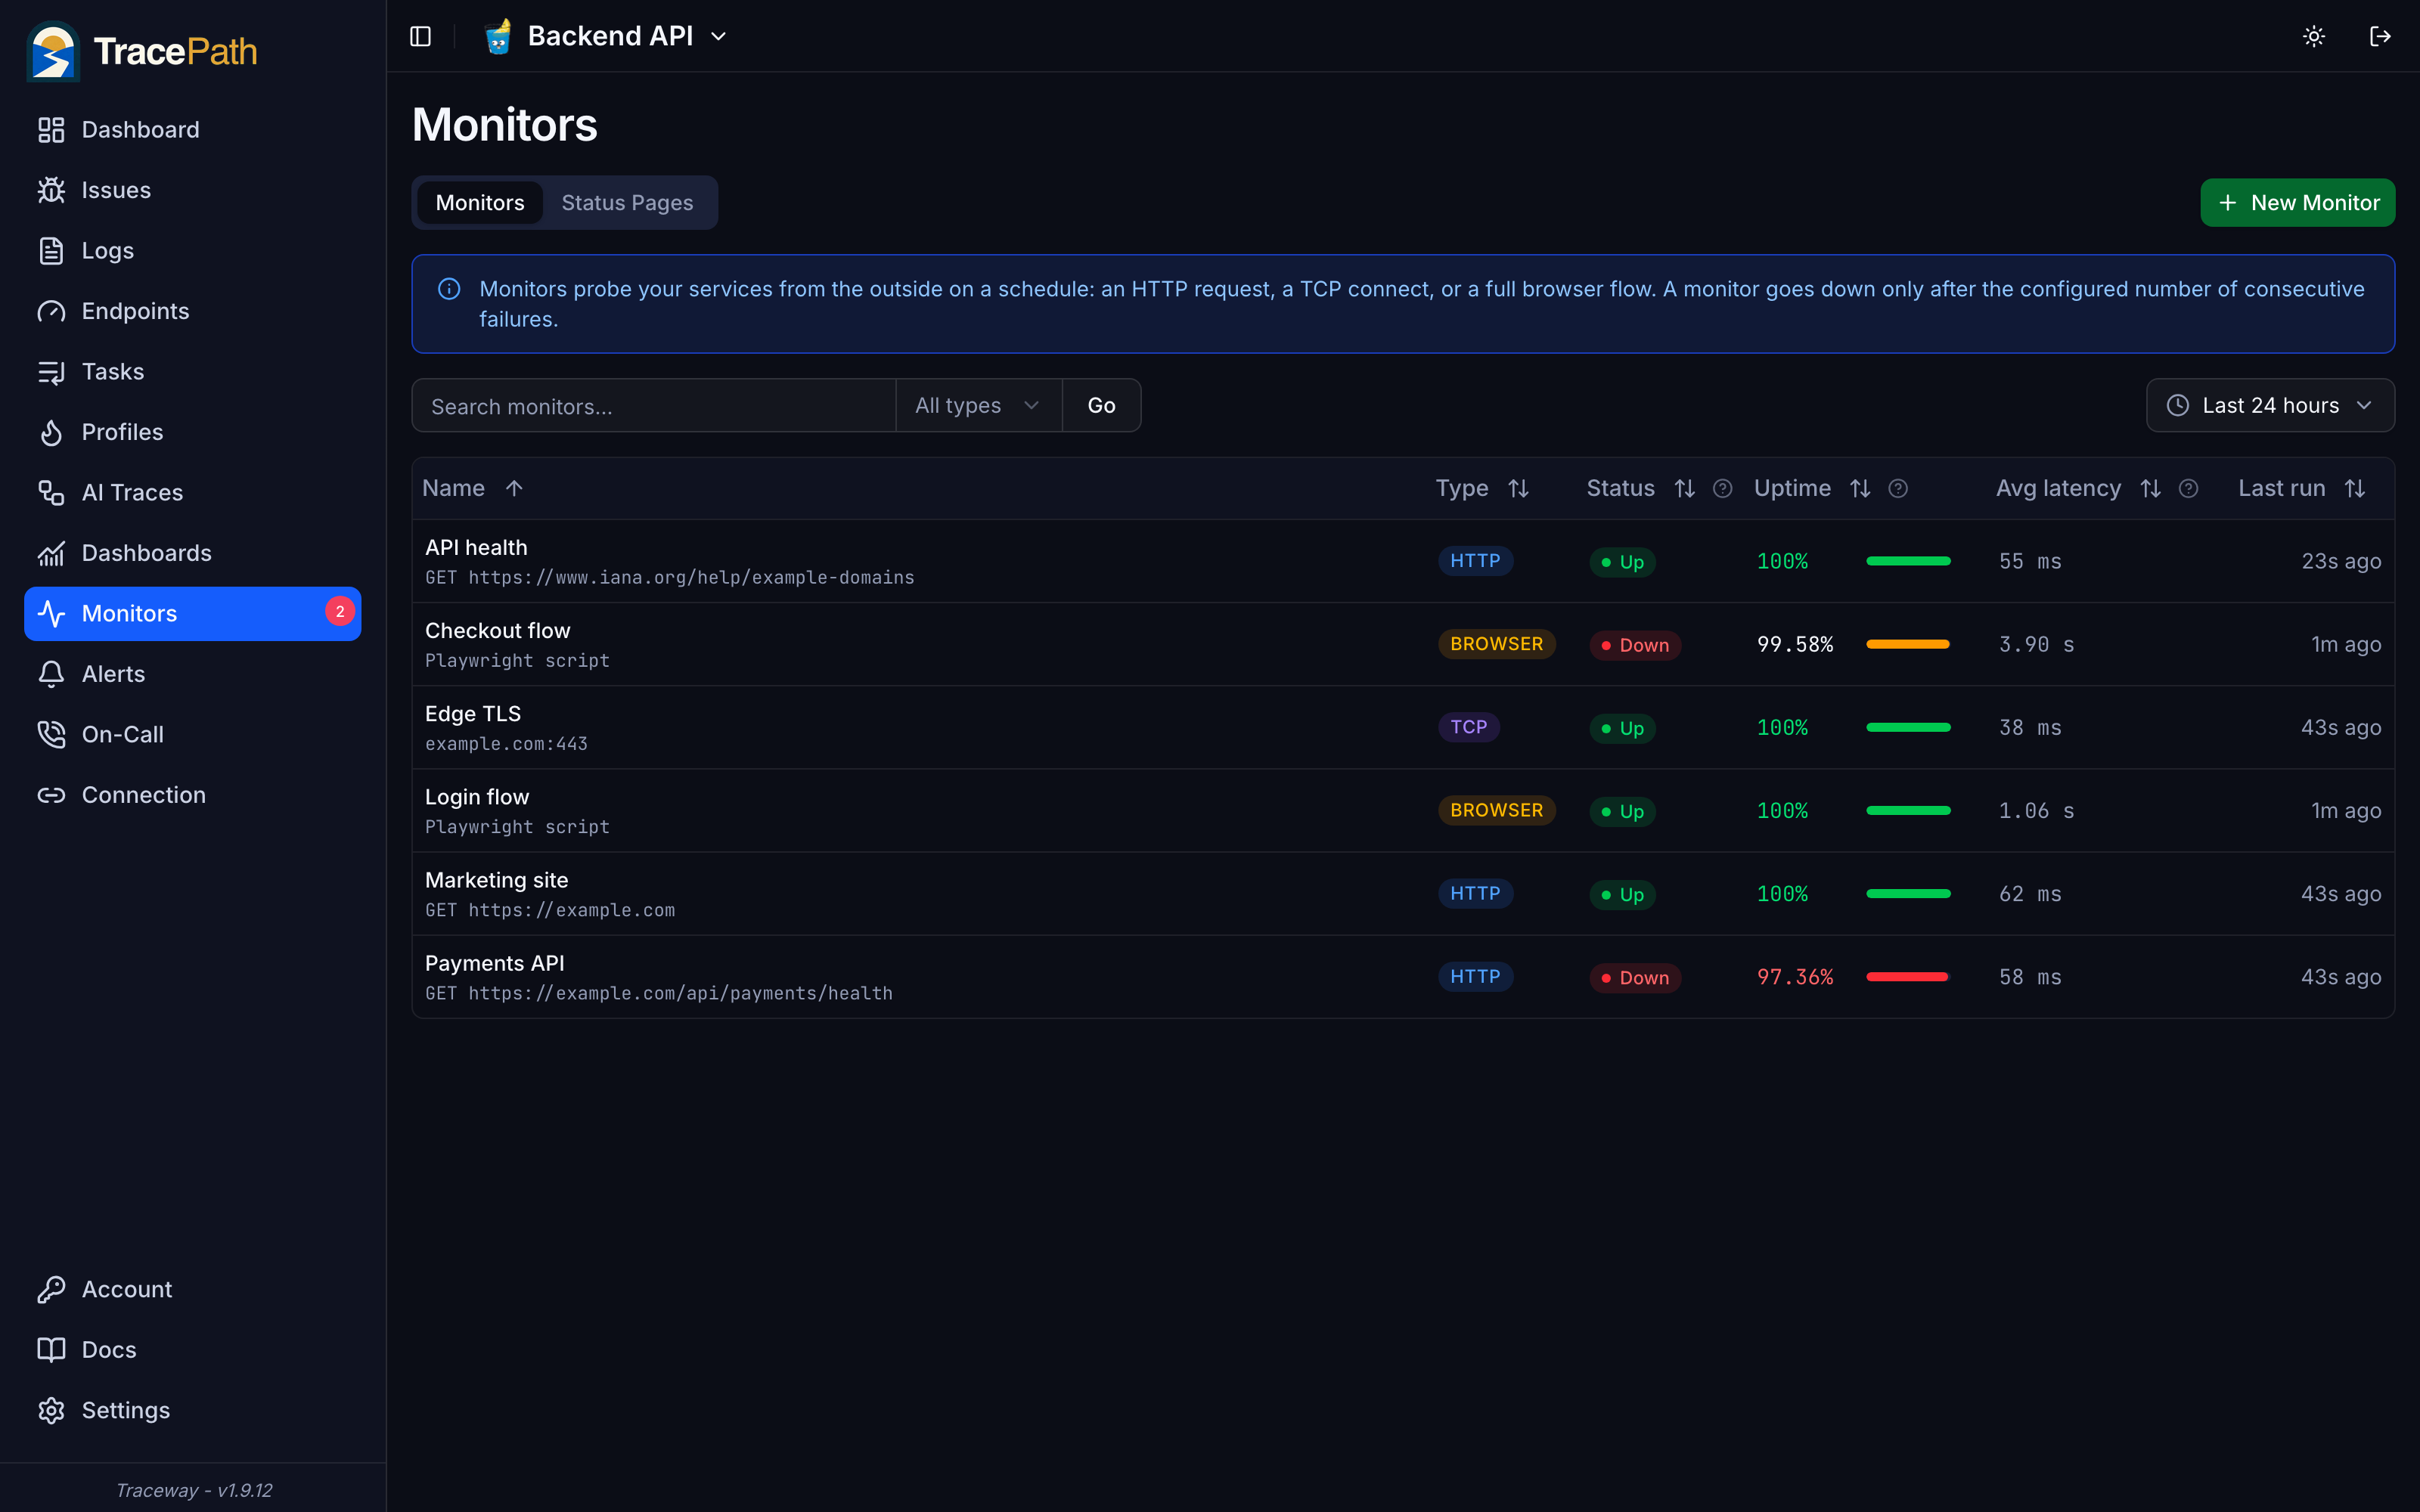
HTTP checks probe like Postman: method, headers, auth, body, and assertions on status codes, response content, response time, and days left on the TLS certificate. TCP checks cover databases, SMTP, and anything that is not HTTP. Every monitor has an interval down to 30 seconds, a timeout, and a failure threshold, so one flaky probe never wakes anyone at 3am.
- Assert on status, body substring or regex, latency, and TLS expiry
- TCP with optional TLS, send payload, and expected response
- Down only after N consecutive failures, flap damping built in
- Uptime and average latency per monitor, at a glance
Your uptime probe is a Playwright test
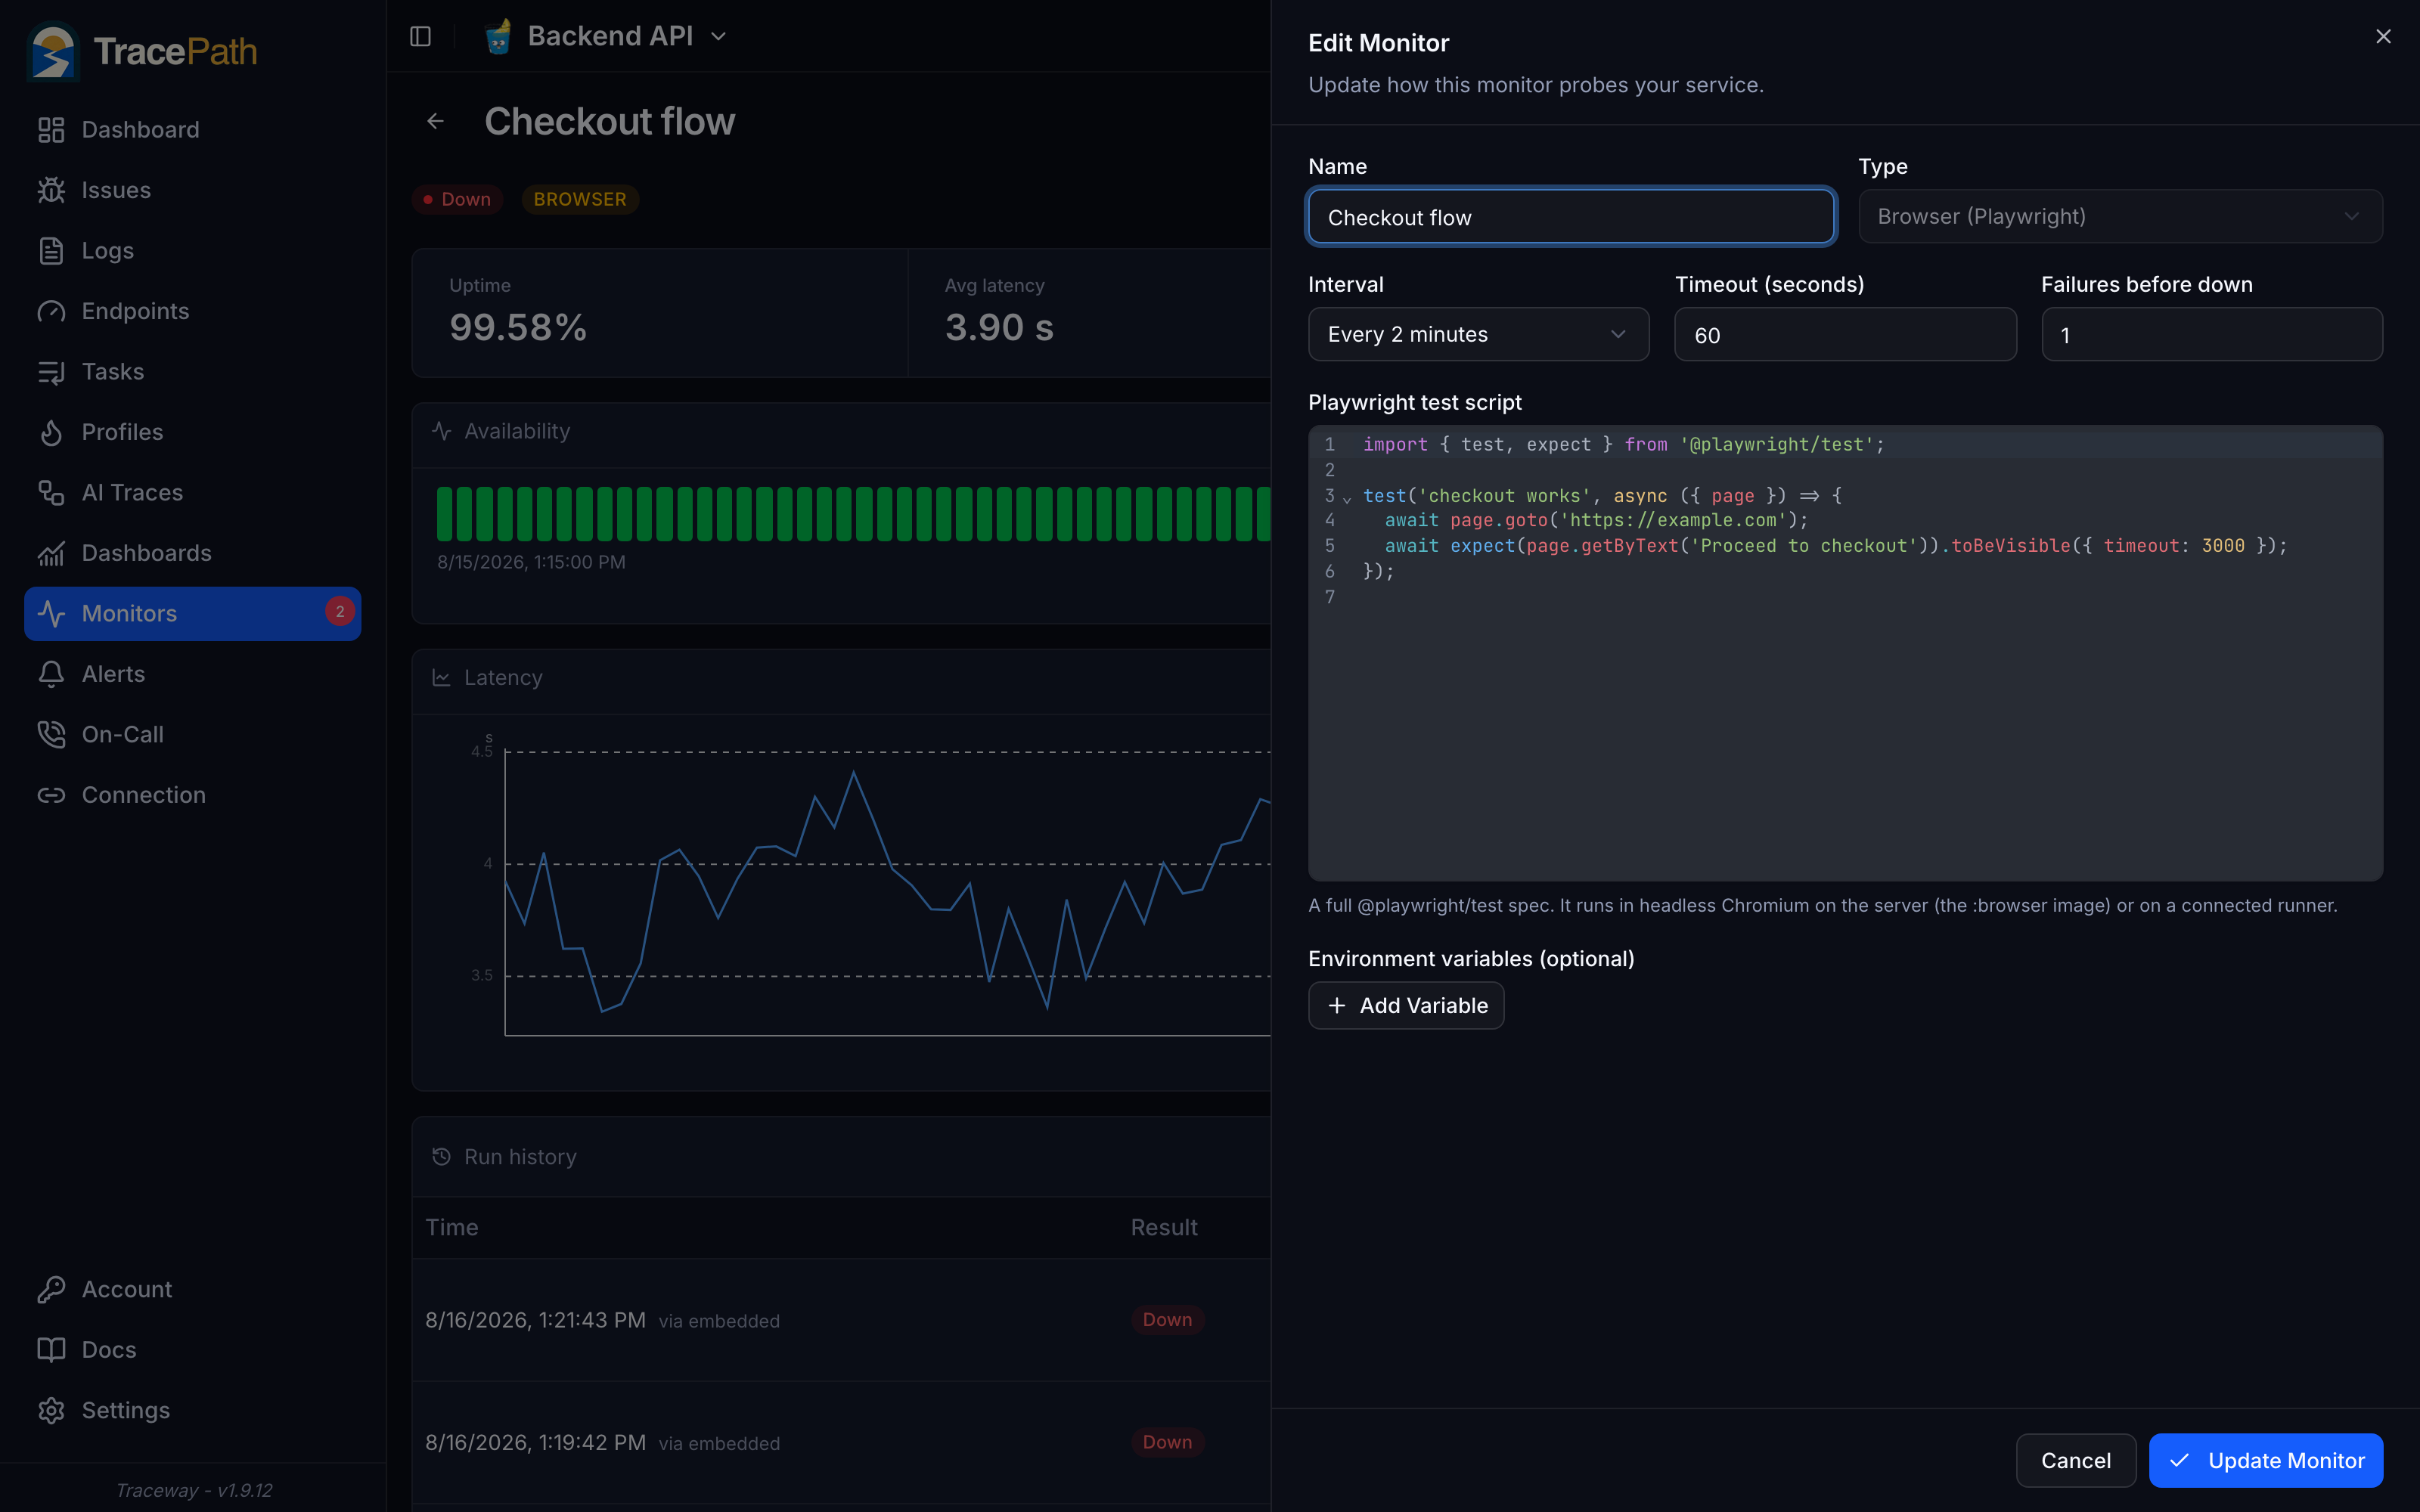
Write a full @playwright/test spec in the editor on the monitor itself, and it runs in headless Chromium on a schedule. A login flow or a checkout journey becomes your availability check, so 'up' means the thing your users actually do still works, not just that the load balancer answers 200.
- Real @playwright/test specs, syntax highlighted in the dialog
- Per-check environment variables; scripts never see server secrets
- Runs embedded in the :browser image, or on remote runner machines
- Runners connect outbound-only, no inbound ports to open
Down comes with evidence
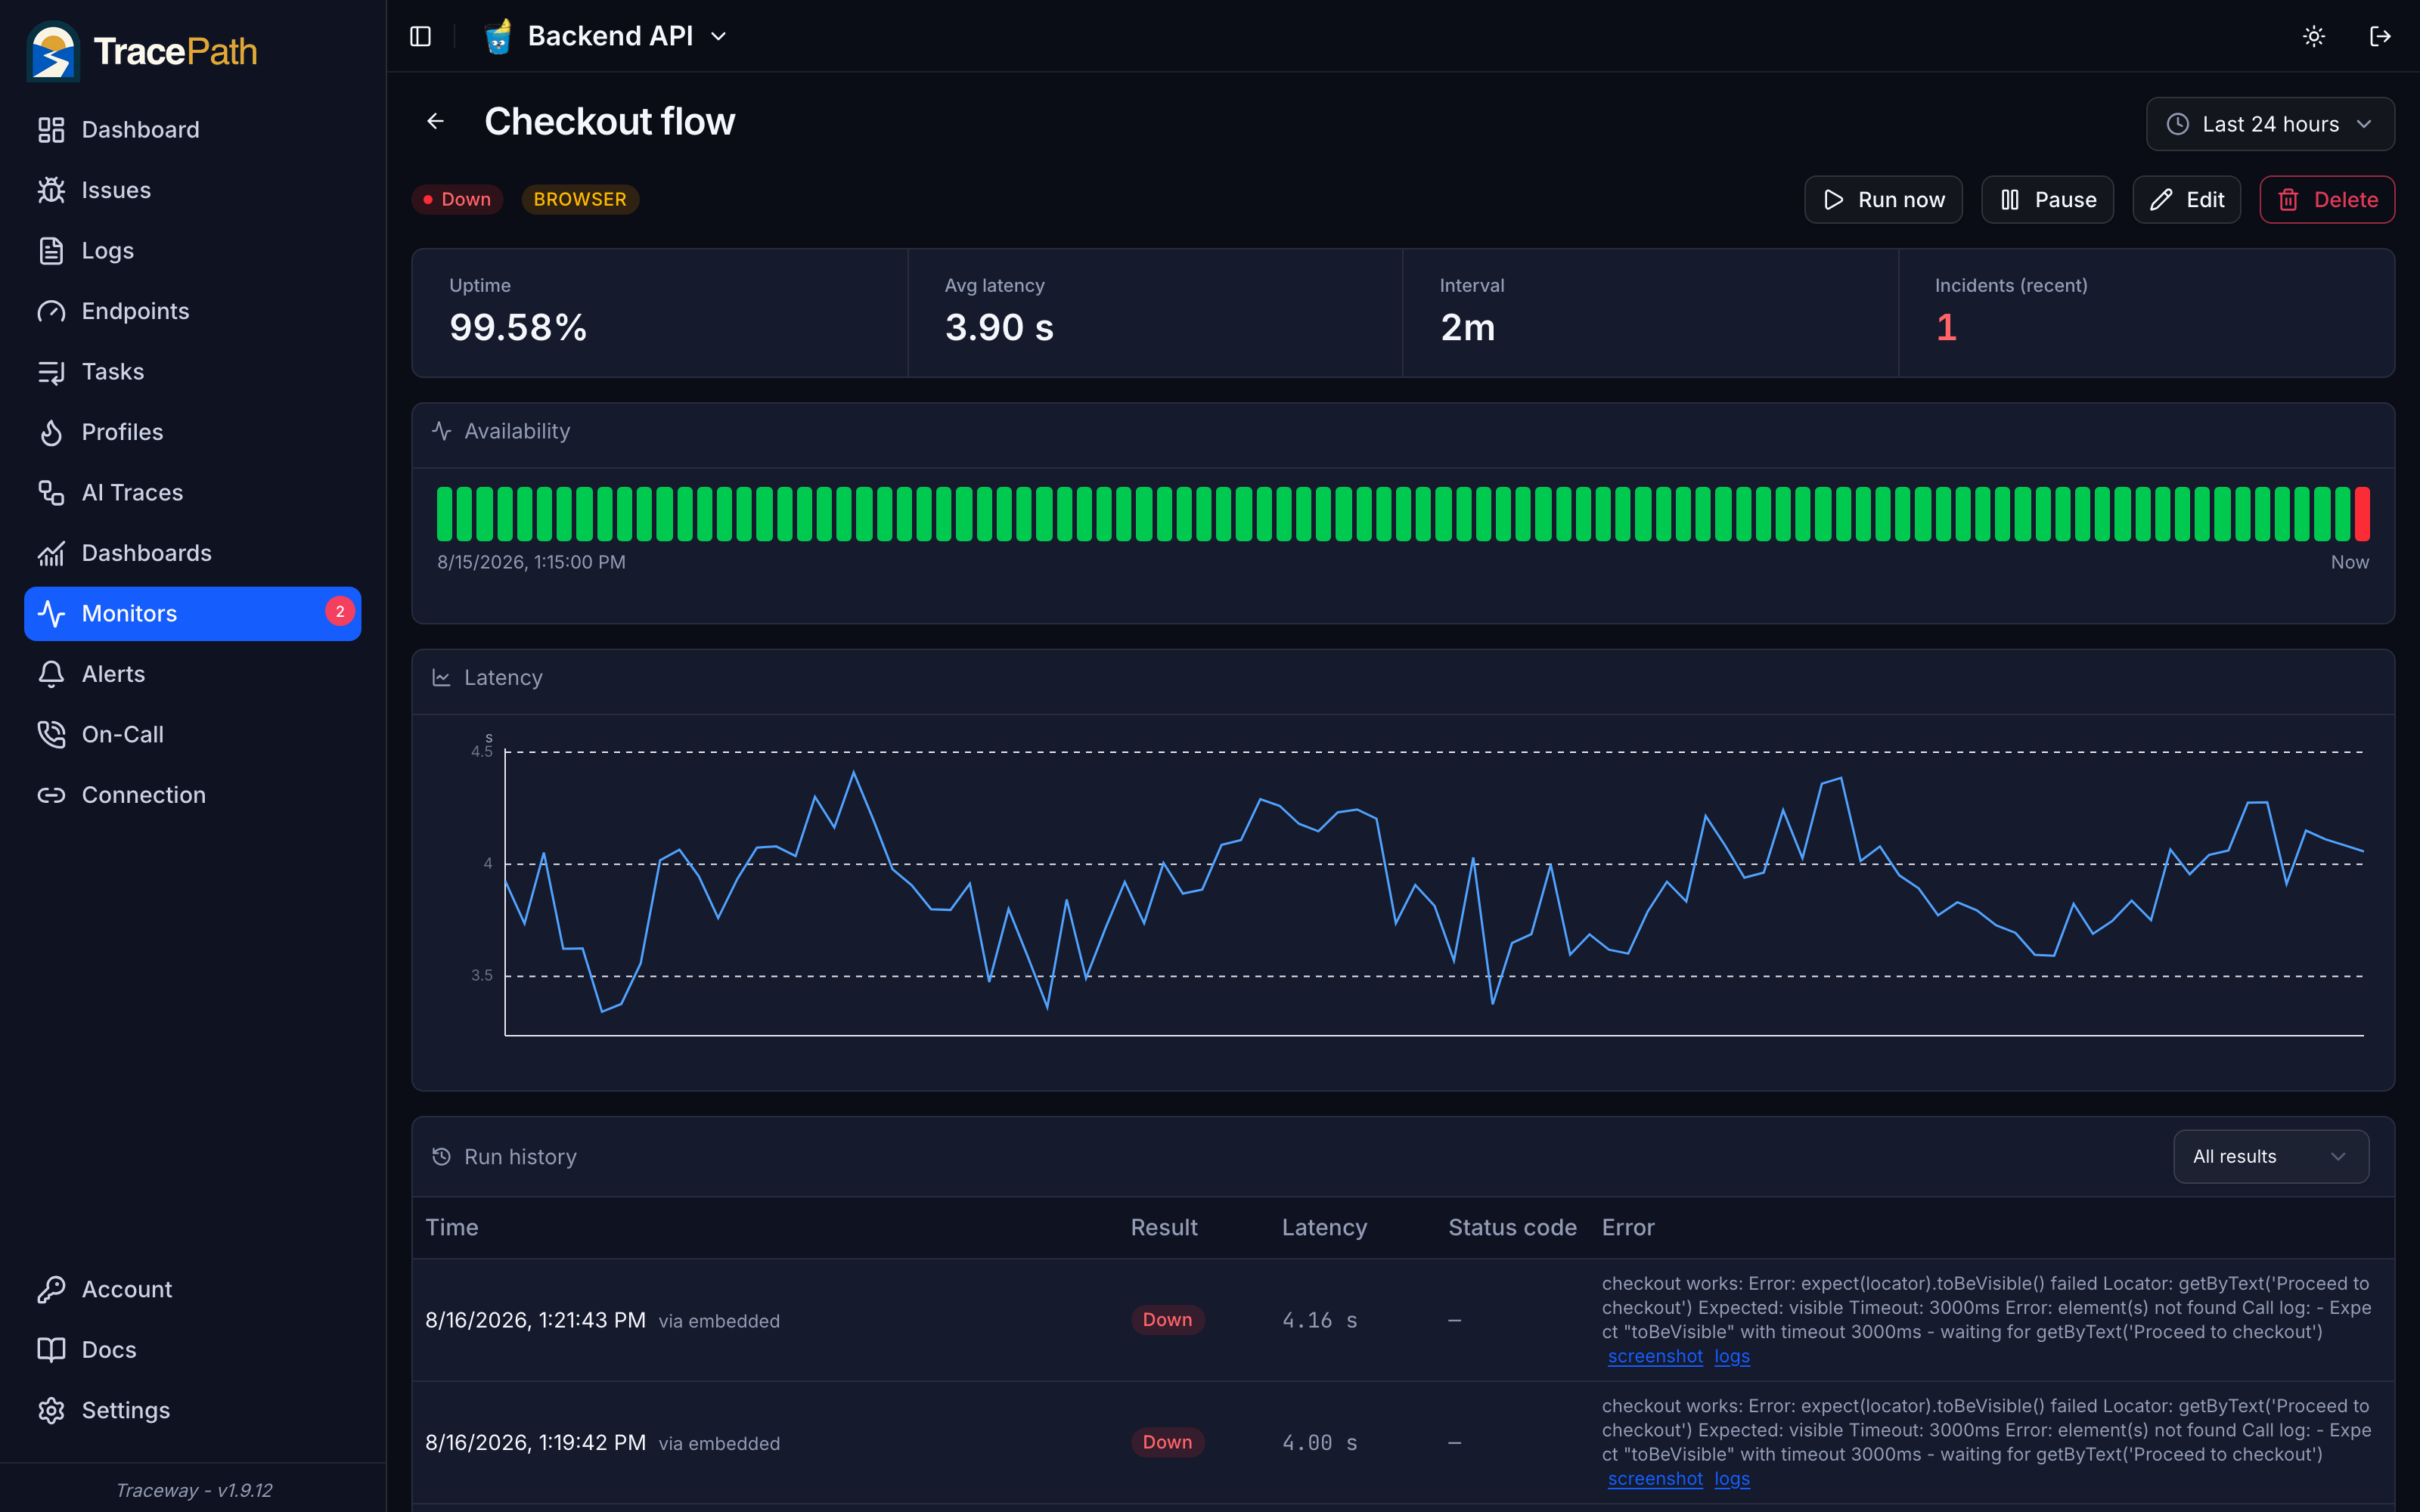
A failed browser run automatically stores the failure screenshot and the Playwright output, both one click from the run history. The monitor page shows availability, a latency chart, every probe with its error, and the incident timeline, so the person who responds starts with the answer instead of a blank terminal.
- Failure screenshot and full Playwright logs per failed run
- Per-probe latency, status code, and error message
- Incidents open and resolve themselves from state transitions
- A probe past its window is recorded as missed, never run late
Tell your users before they ask
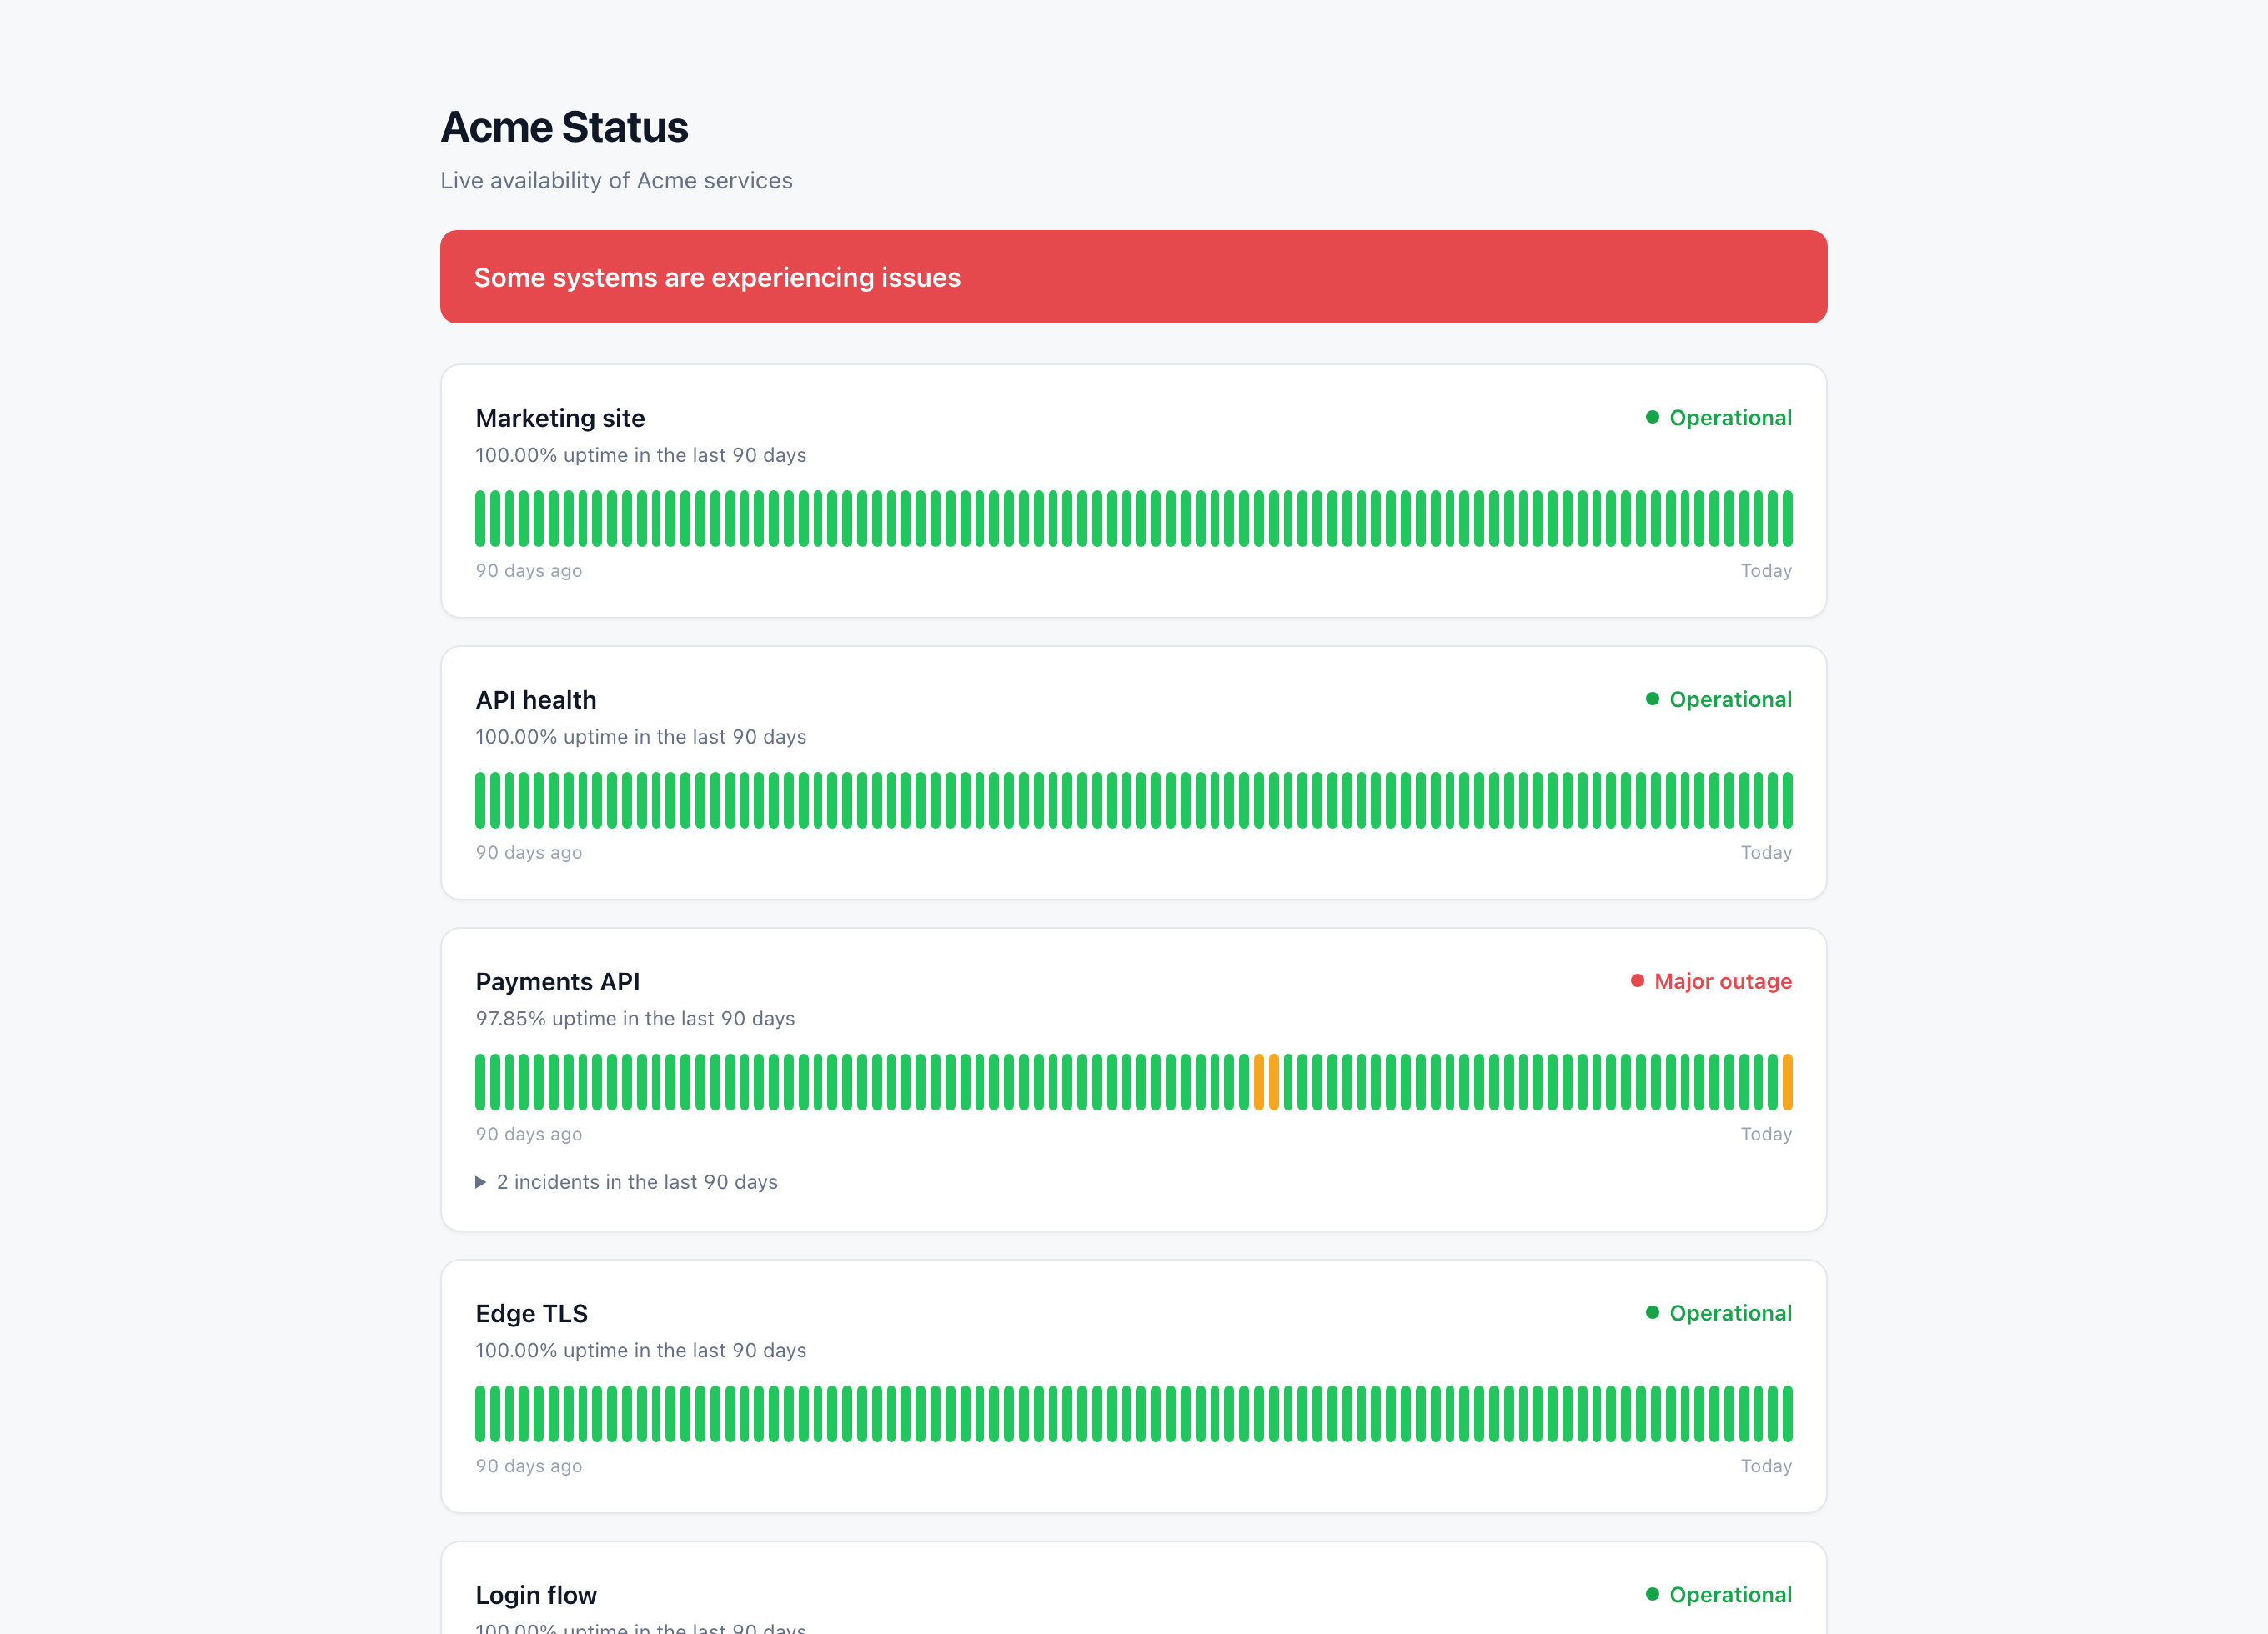
Publish the uptime of selected monitors on a public status page: 90 days of per-day availability, incident history, your name, your logo, no login required. Serve it from your own domain with a CNAME. Latency numbers stay internal; the public page only shows availability.
- Public at /status/your-slug, or on your own custom domain
- 90 days of per-day uptime bars with incident history
- Branding: title, description, and an uploaded logo
- Refreshes itself while your users watch
Every outage gets a timeline
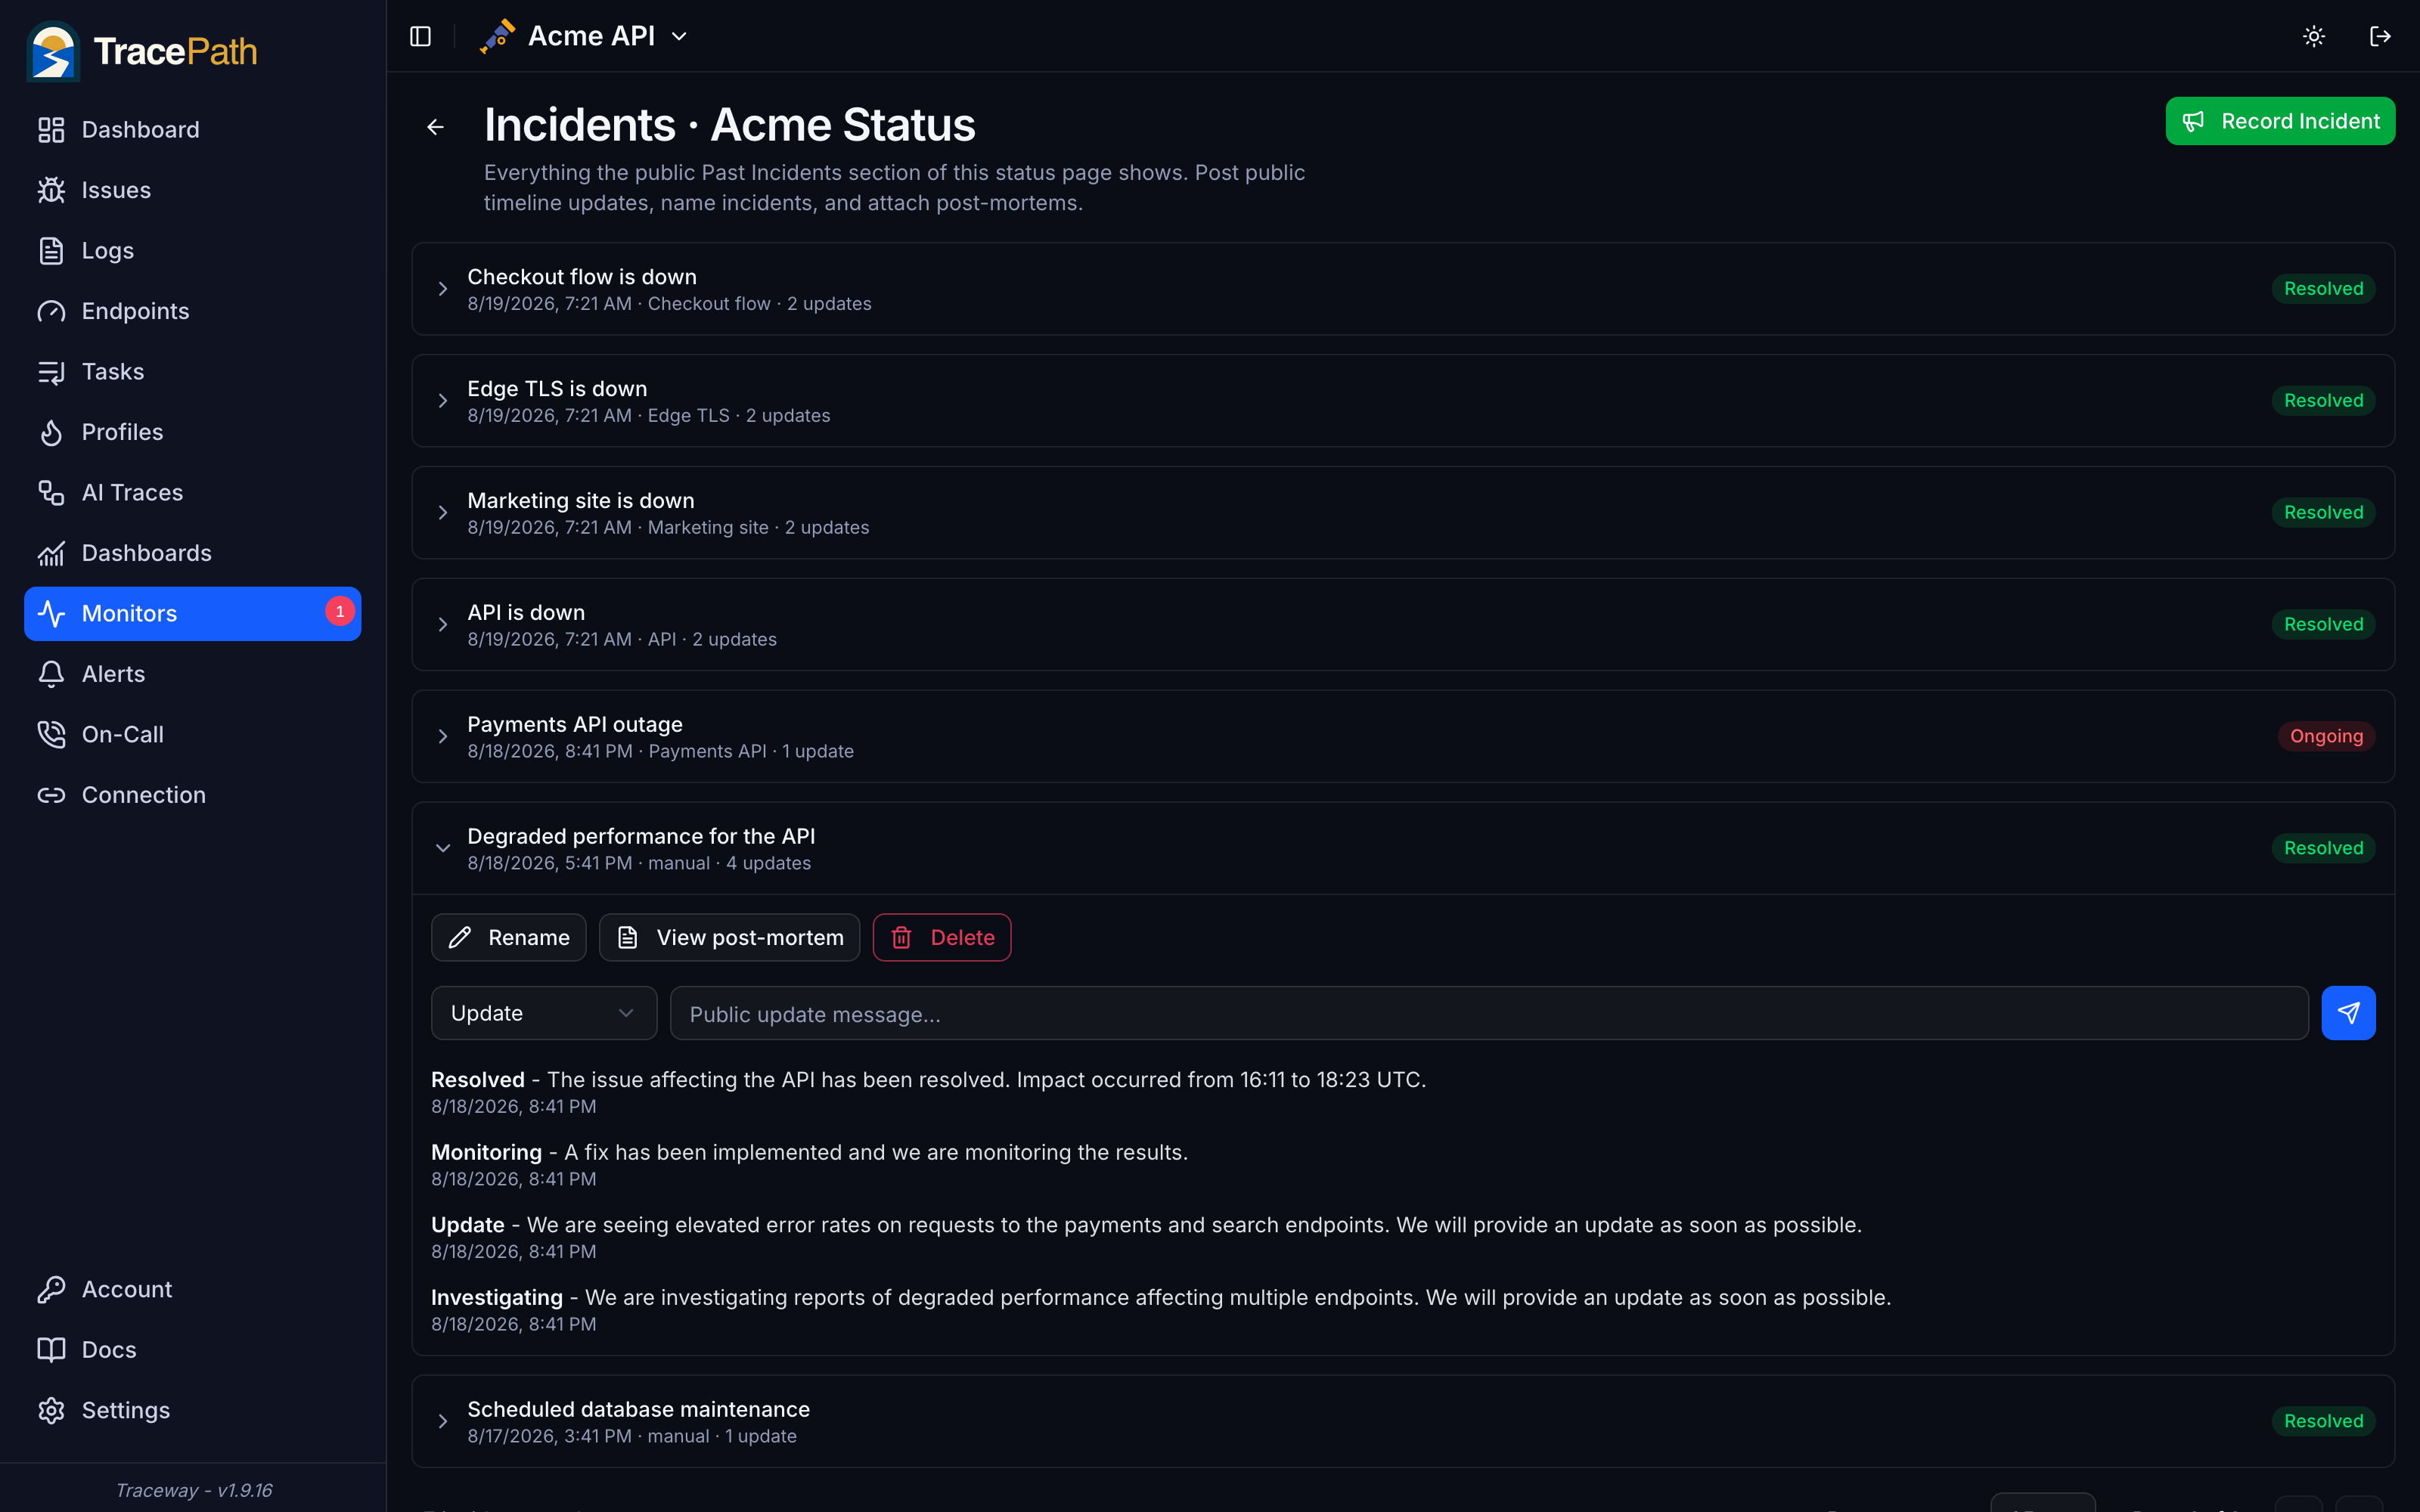
Incidents open and resolve themselves from monitor state changes, with an Investigating entry when they open and a Resolved entry when the service comes back. You own the public story: rename an incident to something users understand and post statuspage-style updates while you work. Outages your monitors missed can be recorded by hand, backdated if needed, without ever touching the uptime numbers.
- Automatic open and resolve from monitor state transitions
- Public titles and Investigating / Identified / Monitoring / Resolved updates
- Record incidents by hand for outages the probes missed
- Probe errors stay internal, the public page only sees your words
The write-up lives next to the incident
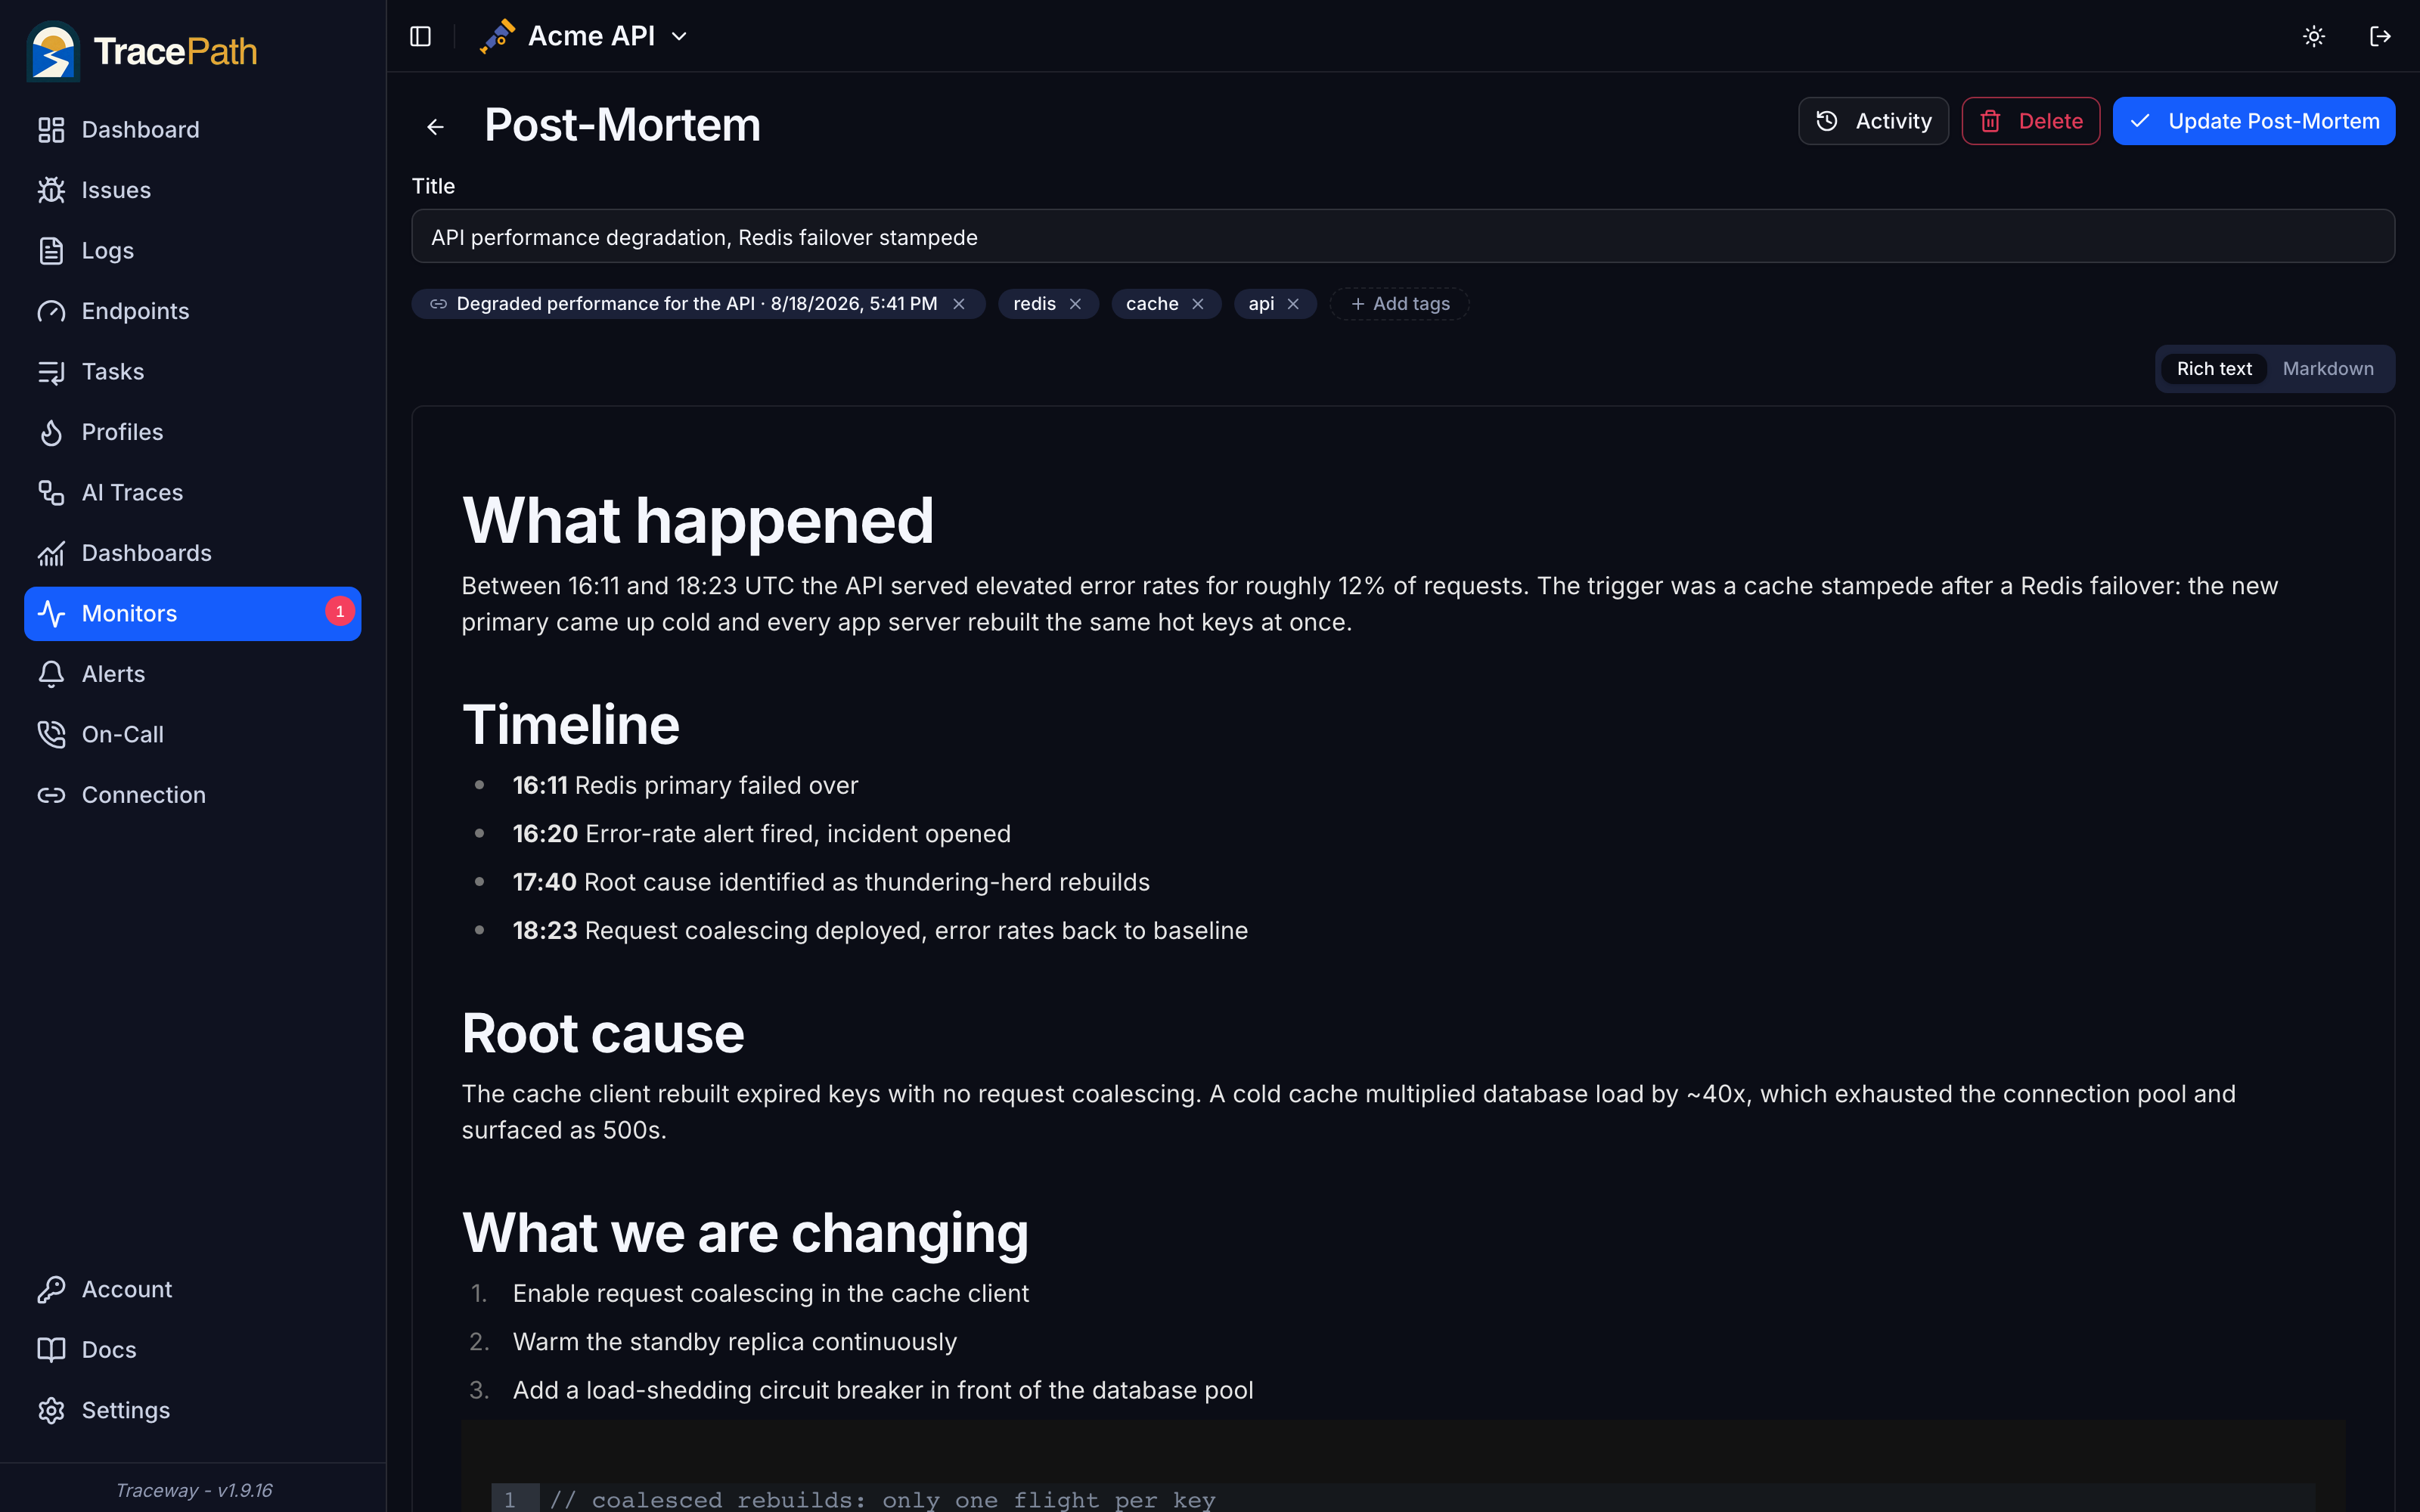
After the fire, write the post-mortem in the same tool: a WYSIWYG markdown editor with a raw-markdown toggle, tags, and a one-click link to the incident it covers. Post-mortems are internal, searchable across titles, content, and tags, and every edit is recorded in an activity log, so the next time something similar breaks, how it was fixed last time is one search away.
- WYSIWYG markdown editor, or flip to raw markdown and paste
- Tag and link each write-up to its incident, one per incident
- Search titles, content, and tags; filter by tag
- Full activity log: who created it, who edited what, and when
Down pages a human, recovery cleans up after itself
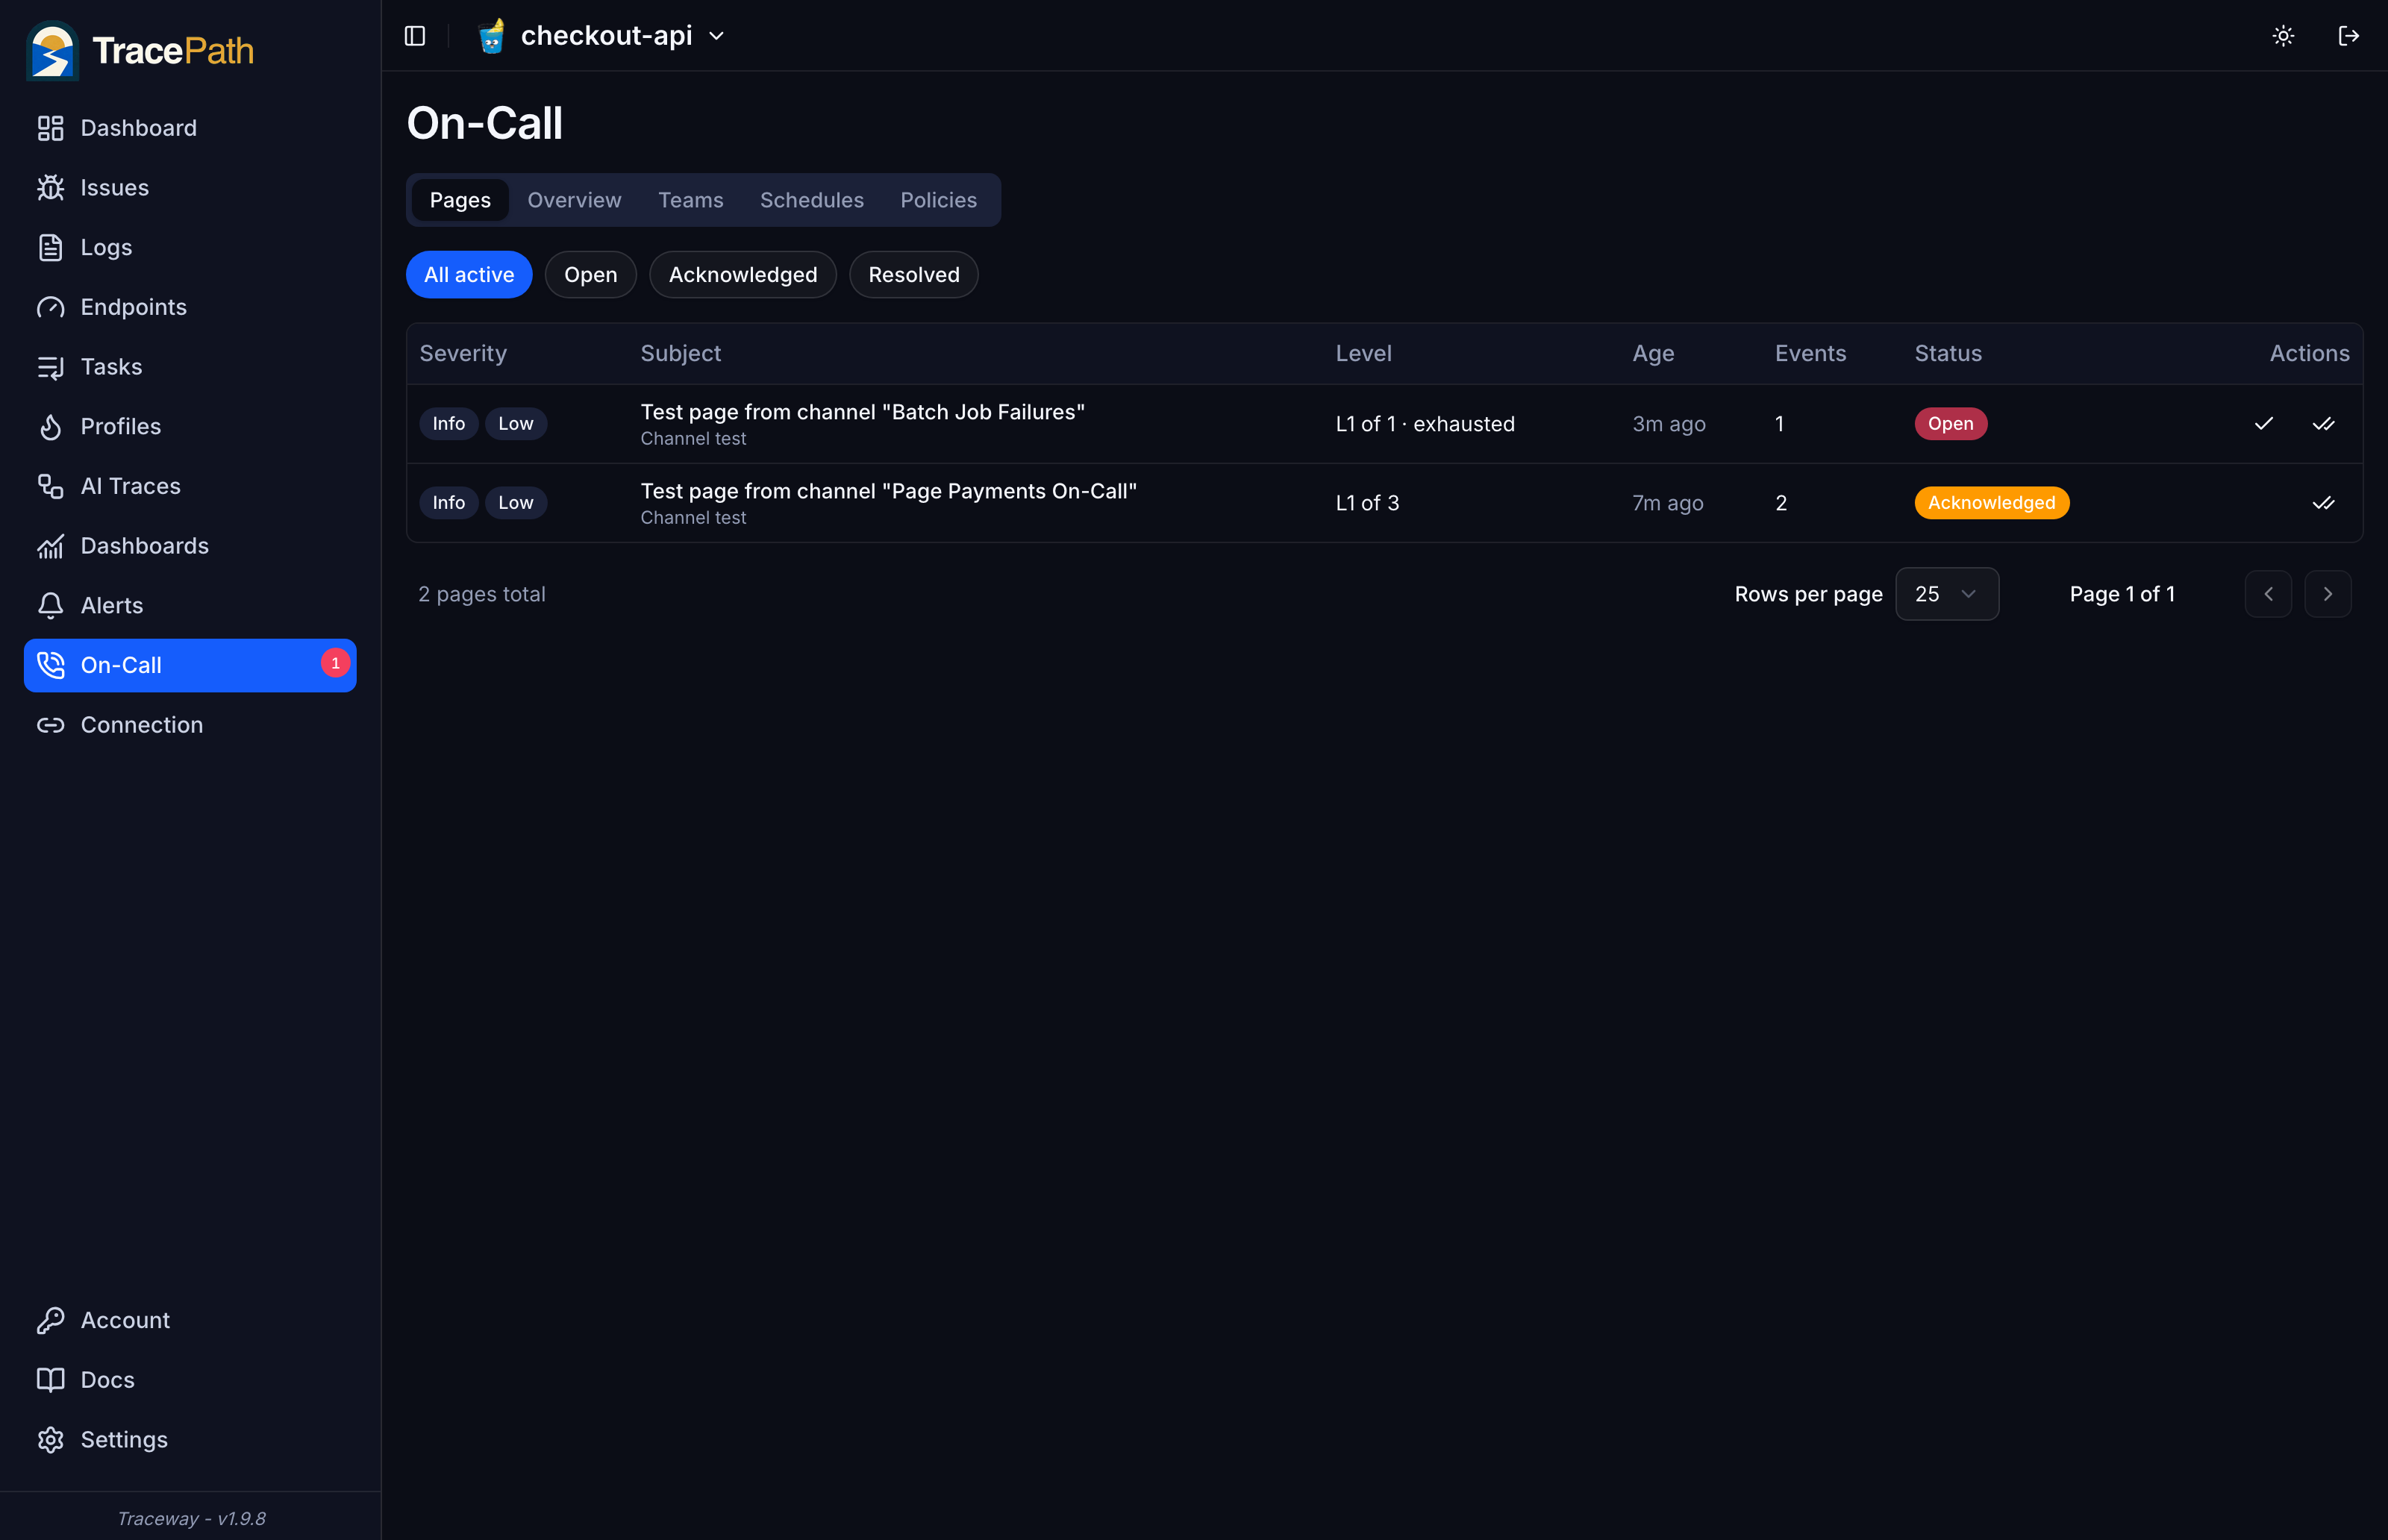
Add a Monitor Down rule and every monitor in the project is covered: a message to Slack, or a real page through your on-call escalation policy. Pages deduplicate per monitor, re-fires never restart the escalation clock, and when the check recovers the page resolves itself, so a blip at night that recovers on its own never needs a human.
- One rule covers every monitor in the project
- Escalation channels open an on-call page instead of a message
- Recovery auto-resolves the page and sends the all-clear
- The alert carries the monitor name and the last probe error
Stop paying for a separate uptime tool
Monitors, status pages, incident timelines, post-mortems, alerting, and on-call in the same tool that holds your traces, logs, and errors. Open source if you self-host.
Questions about monitors
Do I still need UptimeRobot or Pingdom?
Not for the checks themselves. TracePath covers HTTP, TCP, and real-browser probes, flap damping, incident history, public status pages with custom domains, and alerting that can page a rotating on-call schedule. The difference is that the monitor, the alert, the trace, and the stack trace live in one place, so 'the site is down' and 'here is why' are the same screen.
Where do browser checks run?
Wherever you decide. The :browser Docker image runs them inside the container with Chromium baked in. Any other deployment, including a plain binary with no Docker, can either install Node and a Playwright harness next to the backend, or hand execution to tracepath-runner machines that connect outbound-only and claim work over a long-poll. Scripts always run with an allowlisted environment and never see your server's secrets.
Does TracePath cover incident management, or just detection?
The whole lifecycle. Monitors open and resolve incidents automatically, you give them public titles and post timeline updates (Investigating, Identified, Monitoring, Resolved) while you work, and outages the probes missed can be recorded by hand. Afterwards you write the internal post-mortem in a WYSIWYG markdown editor, tag it, link it to the incident, and find it again later by searching titles, content, and tags. Statuspage, incident tracker, and post-mortem wiki, without three more subscriptions.
What stops one slow probe from marking my site down?
The failure threshold. A monitor only transitions to down after the configured number of consecutive failures, and only that transition alerts. Recovery works the same way in reverse: the first successful probe flips it back and sends the all-clear.
What happens if my TracePath instance is down?
The truth is preserved. Runs live in a durable queue, and a probe that outlives its execution window is recorded as missed rather than executed late, so the uptime timeline shows a gap instead of a fabricated 100%. A stale 'is it up' answer is worse than no answer.
Can the status page live on my own domain?
Yes. Set the custom domain on the status page, point a CNAME at your TracePath instance, and terminate TLS for that hostname at your reverse proxy. Visitors landing on that host are routed straight to the status page, with no TracePath branding beyond a footer credit.
Is any of this gated behind a paid plan?
Self-hosted TracePath is 100% open source with every monitor type, status pages, and alerting included. On TracePath Cloud, HTTP and TCP monitors and status pages are part of every plan; browser checks are currently a self-hosted feature because they execute your scripts, and your plan sizes how many monitors you can create.