Measure what matters, without the bill shock.
Application metrics via OpenTelemetry, automatic server metrics, and flexible widget dashboards, all included, with no per-metric billing and no surprise overages.
Application metrics via OpenTelemetry
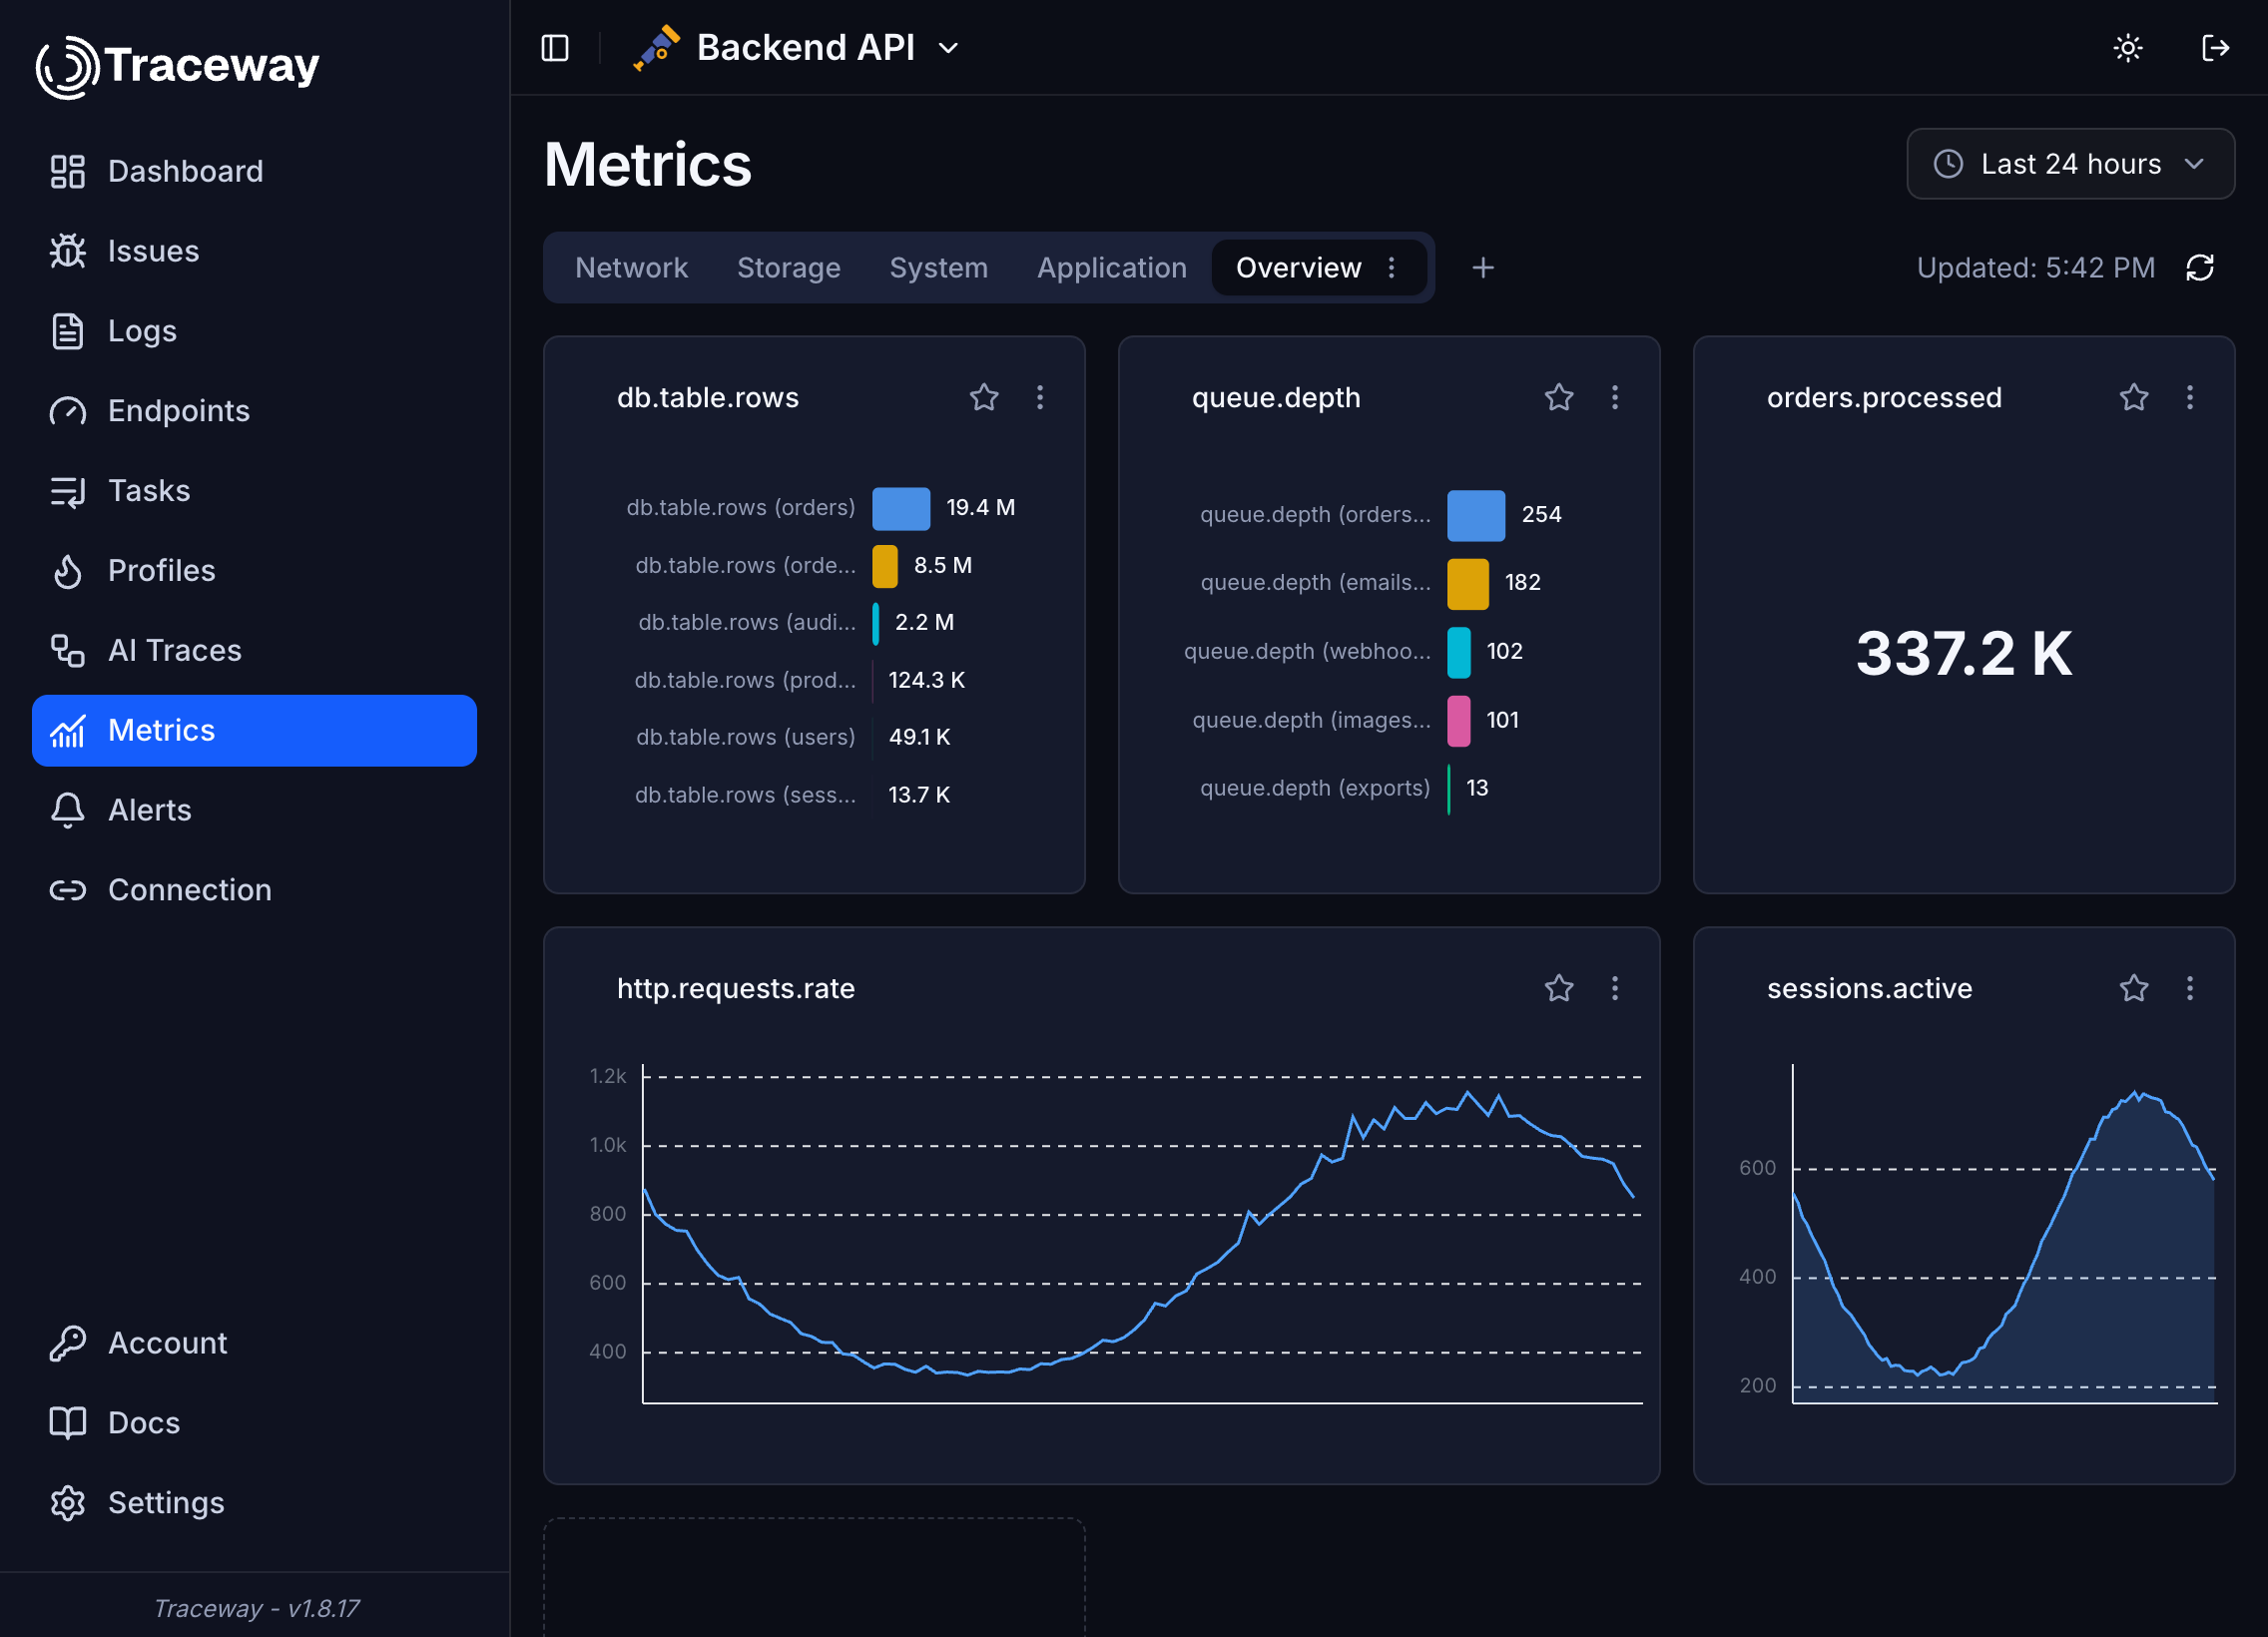
Emit Counter, Gauge, and Histogram metrics through the OpenTelemetry SDK you already have. TracePath ingests OTLP natively, preserves units and dimensional tags, and bills nothing per metric.
- OTLP/HTTP and OTLP/gRPC ingestion
- Counter / Gauge / Histogram preserved natively
- Dimensional tags become facet filters
- No per-metric billing
CPU, memory, disk, network. One line to install
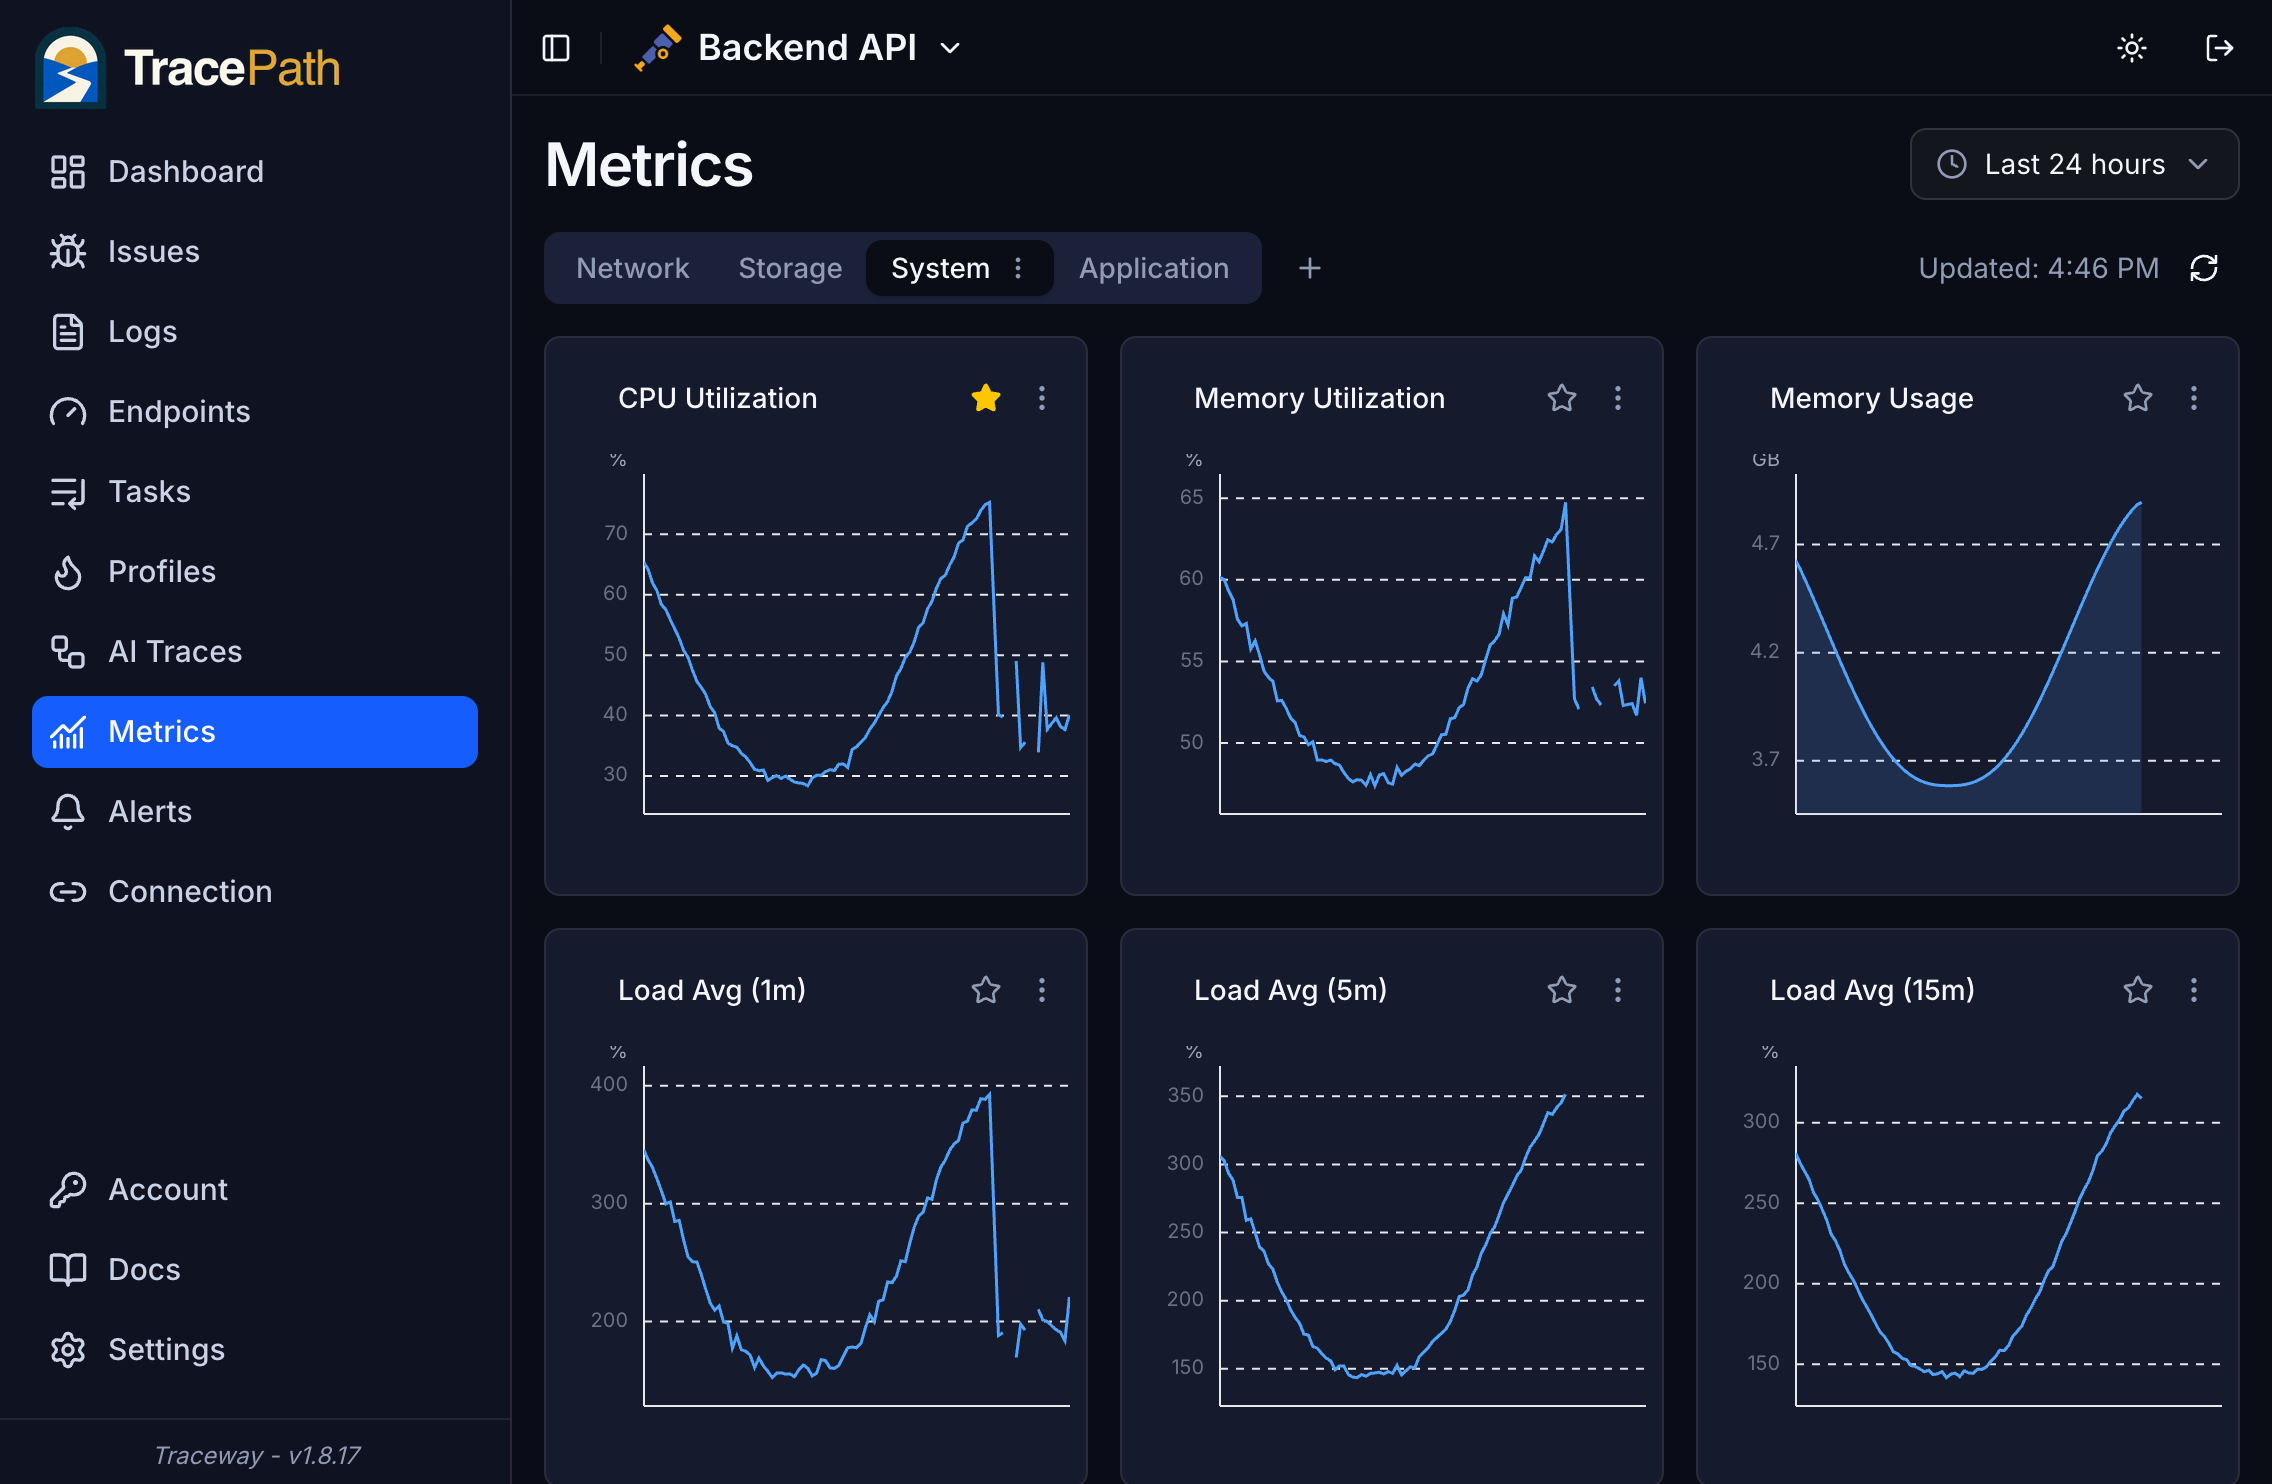
The TracePath OTel Agent is a pre-built OpenTelemetry Collector distribution that scrapes host metrics every 60 seconds and ships them to your project over OTLP/HTTP. Install with a single curl, no config file required.
- One-line install on Linux (systemd), macOS (launchd), or Windows
- CPU, memory, load, disk, filesystem, network
- 60-second collection interval via hostmetricsreceiver
- Runs alongside your apps, no code changes
- Also tails any log files you point it at (opt-in)
Dashboards that match your team's mental model
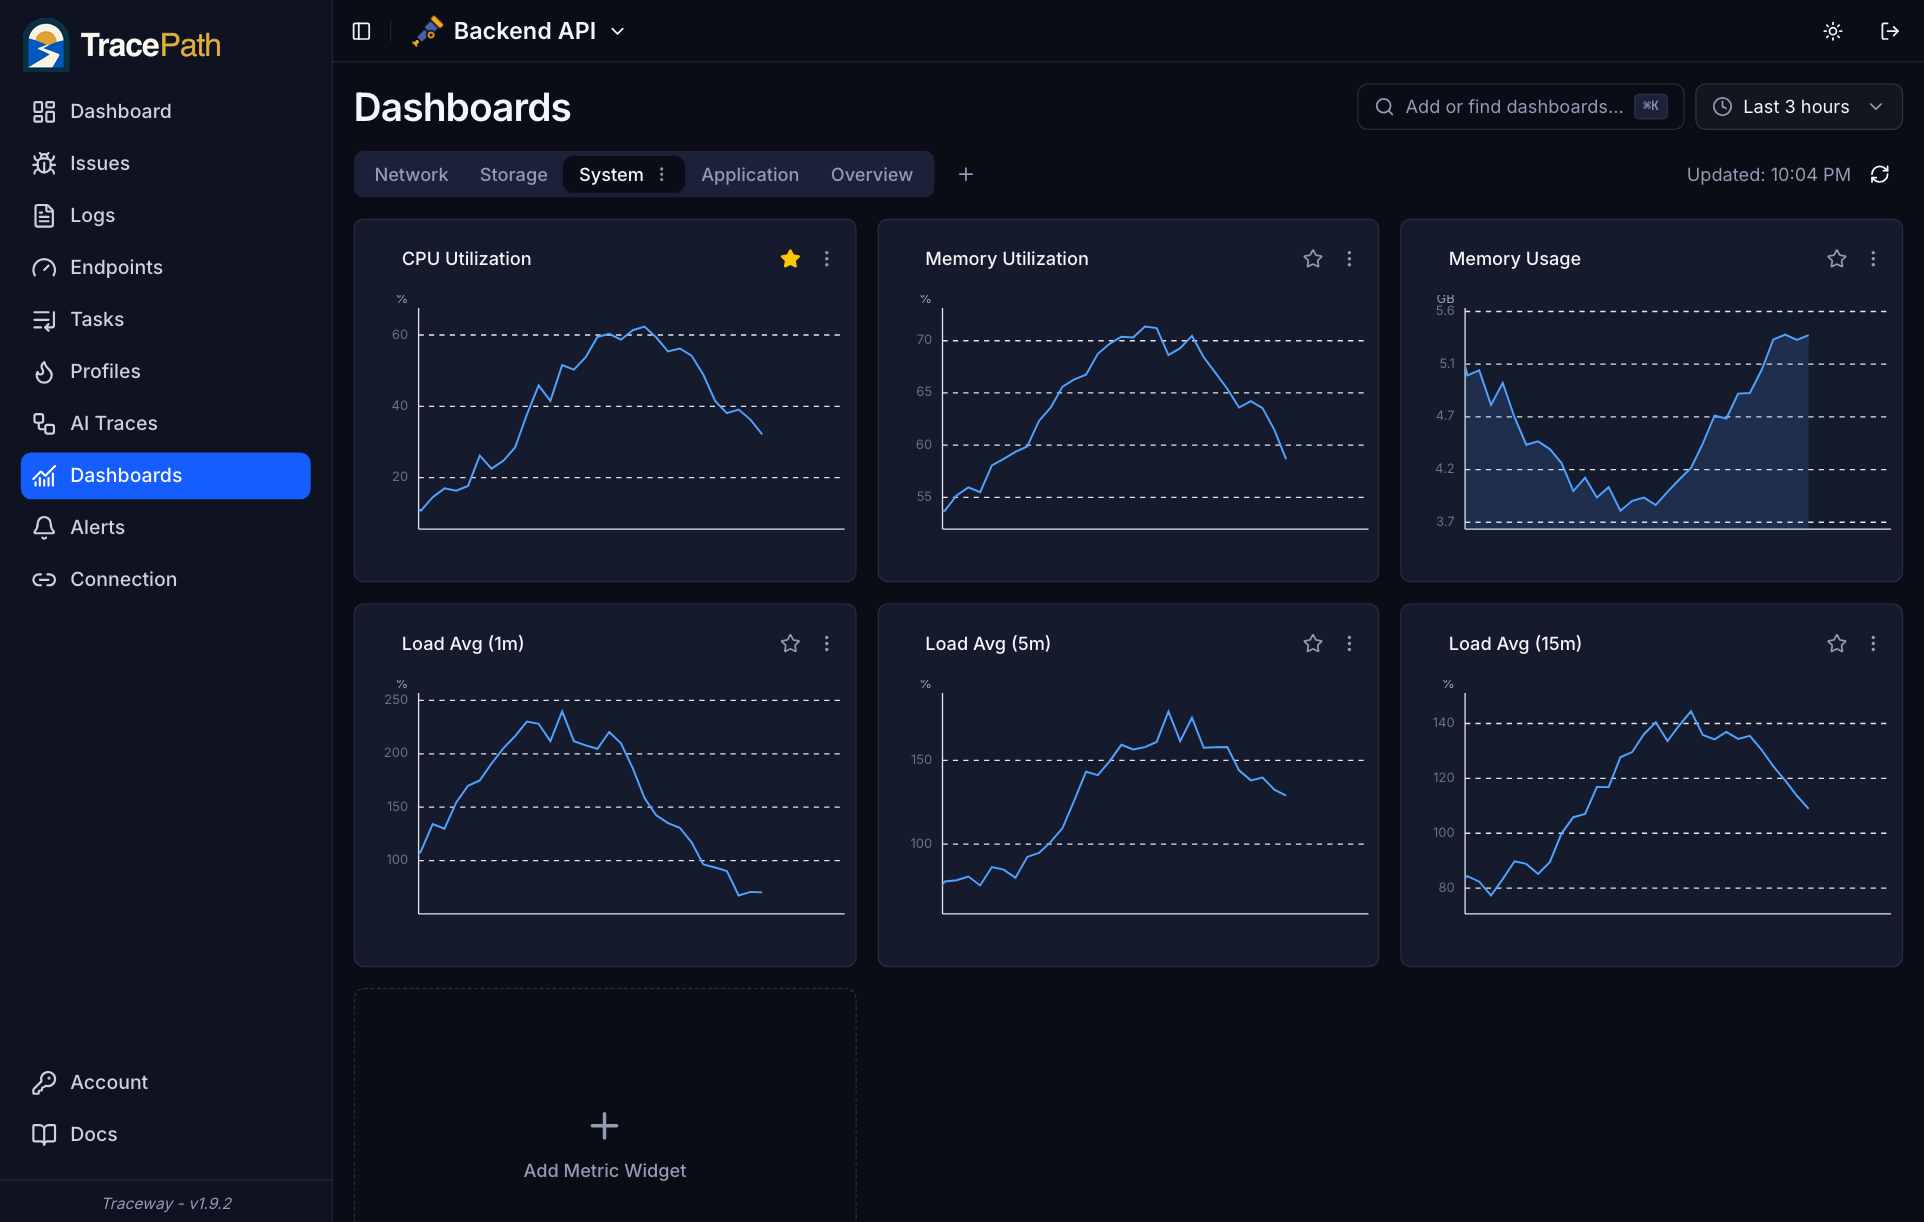
Build a dashboard once and apply it across every project in your organization. Each dashboard is a plain JSON document, so you can edit it as code, keep it in your repo, or import the Grafana dashboards you already have.
- One dashboard, applied across projects
- Template marketplace: OTel host agent, Go runtime, ClickHouse, DuckDB
- Import existing Grafana dashboards
- Search and add anything with ⌘K
Ship metrics in 5 minutes
Application + server metrics. Included on every plan. No per-metric billing.
Questions about metrics
How do I emit an application metric?
Point any OpenTelemetry SDK at /api/otel/v1/metrics. OTLP/HTTP and OTLP/gRPC are both supported natively. Counter, Gauge, and Histogram metric types are ingested as-is, and dimensional tags become facet filters in the dashboard.
If you're instrumenting from scratch, the OpenTelemetry metrics SDK is the recommended path for every language we support.
What host metrics are collected automatically?
The TracePath OTel Agent is a pre-built OpenTelemetry Collector distribution that you install on the host with a single curl. It scrapes CPU, memory, load, disk, filesystem, and network metrics via the upstream hostmetricsreceiver every 60 seconds and ships them to your TracePath project over OTLP/HTTP. Per-process metrics are opt-in via TRACEPATH_PROCESS_NAMES.
No config file to write. You set TRACEPATH_TOKEN and the installer wires up systemd/launchd/Windows service for you. In-process Go runtime metrics (goroutines, heap objects, GC) are emitted separately by the Go client SDK if you use it.
Do custom metrics count toward my event limit?
No. Metrics are included at no additional event cost. Only issues, HTTP requests, and background tasks count toward your event limit. This means you can emit thousands of custom metrics without worrying about billing.
Can I query metrics by tag or dimension?
Yes. Every tag becomes a facet you can filter on; dashboards let you build per-dimension chart panels. For example, a `plan` tag on a signups metric lets you chart signups broken down by plan, region, or tenant.