Dashboards you can diff, review, and ship.
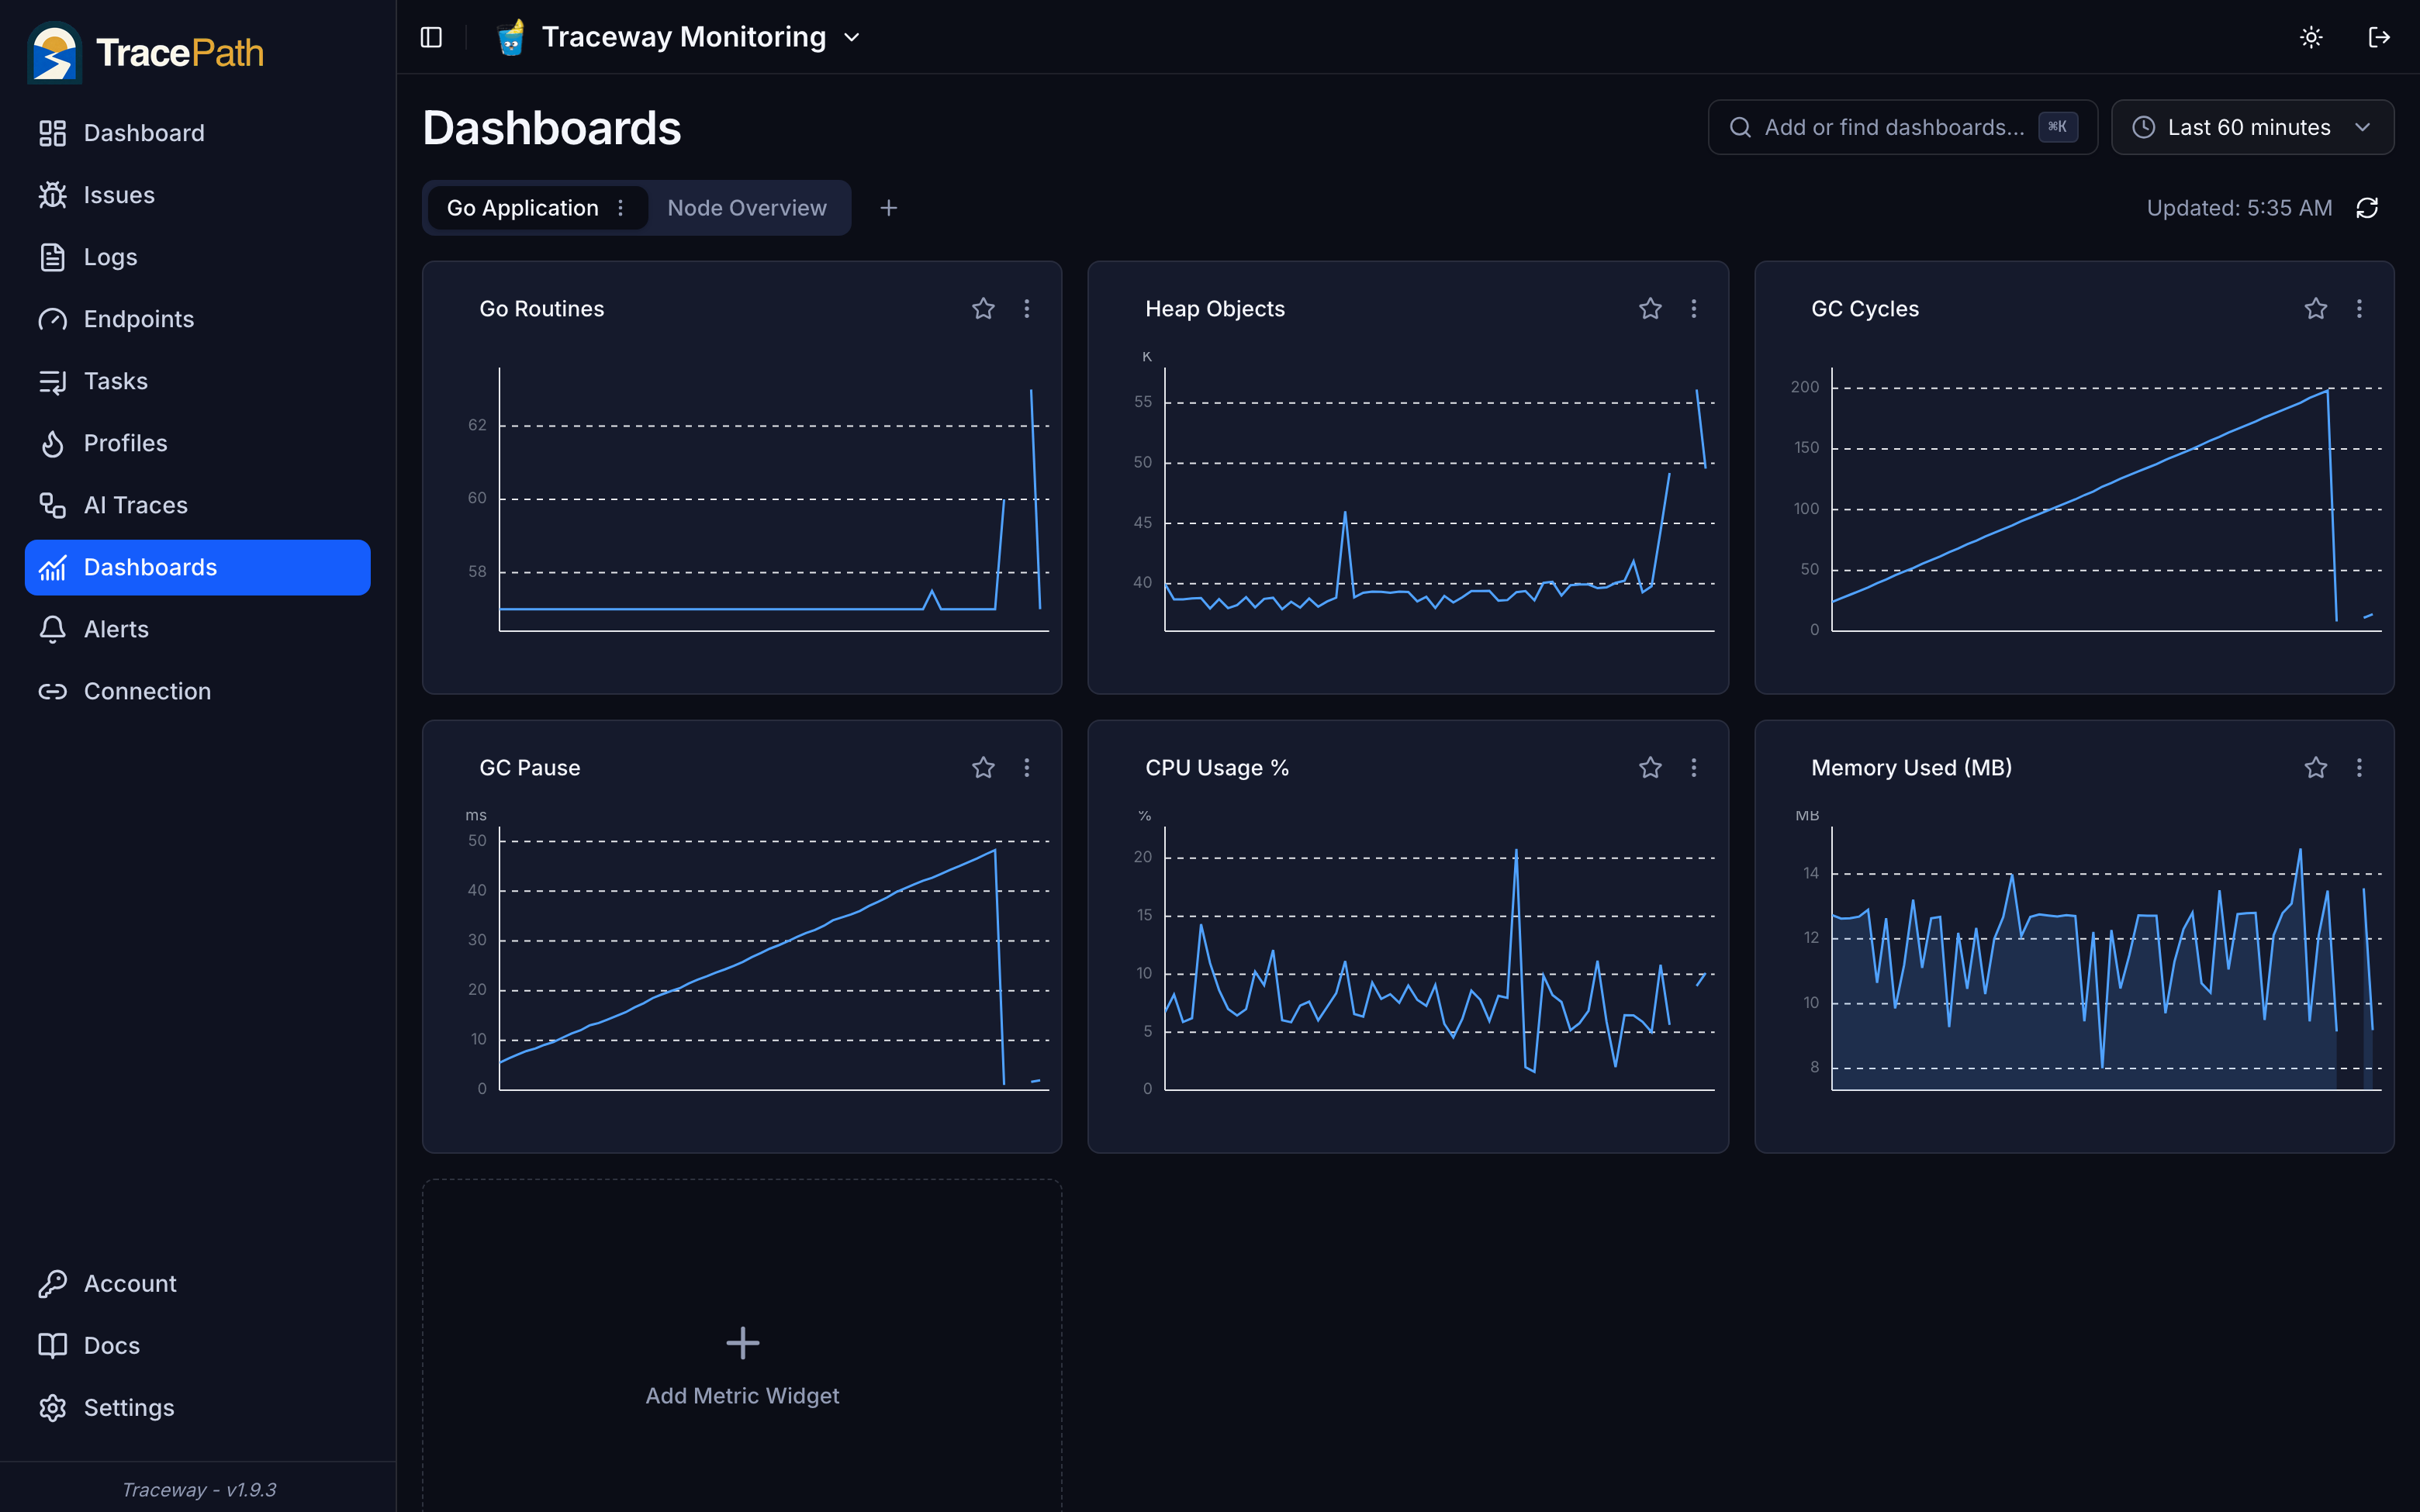
Every TracePath dashboard is a plain JSON document underneath. Build it in the UI, export it to your repo, sync it from CI, and apply it across every project in your organization. No click-ops, no drift.
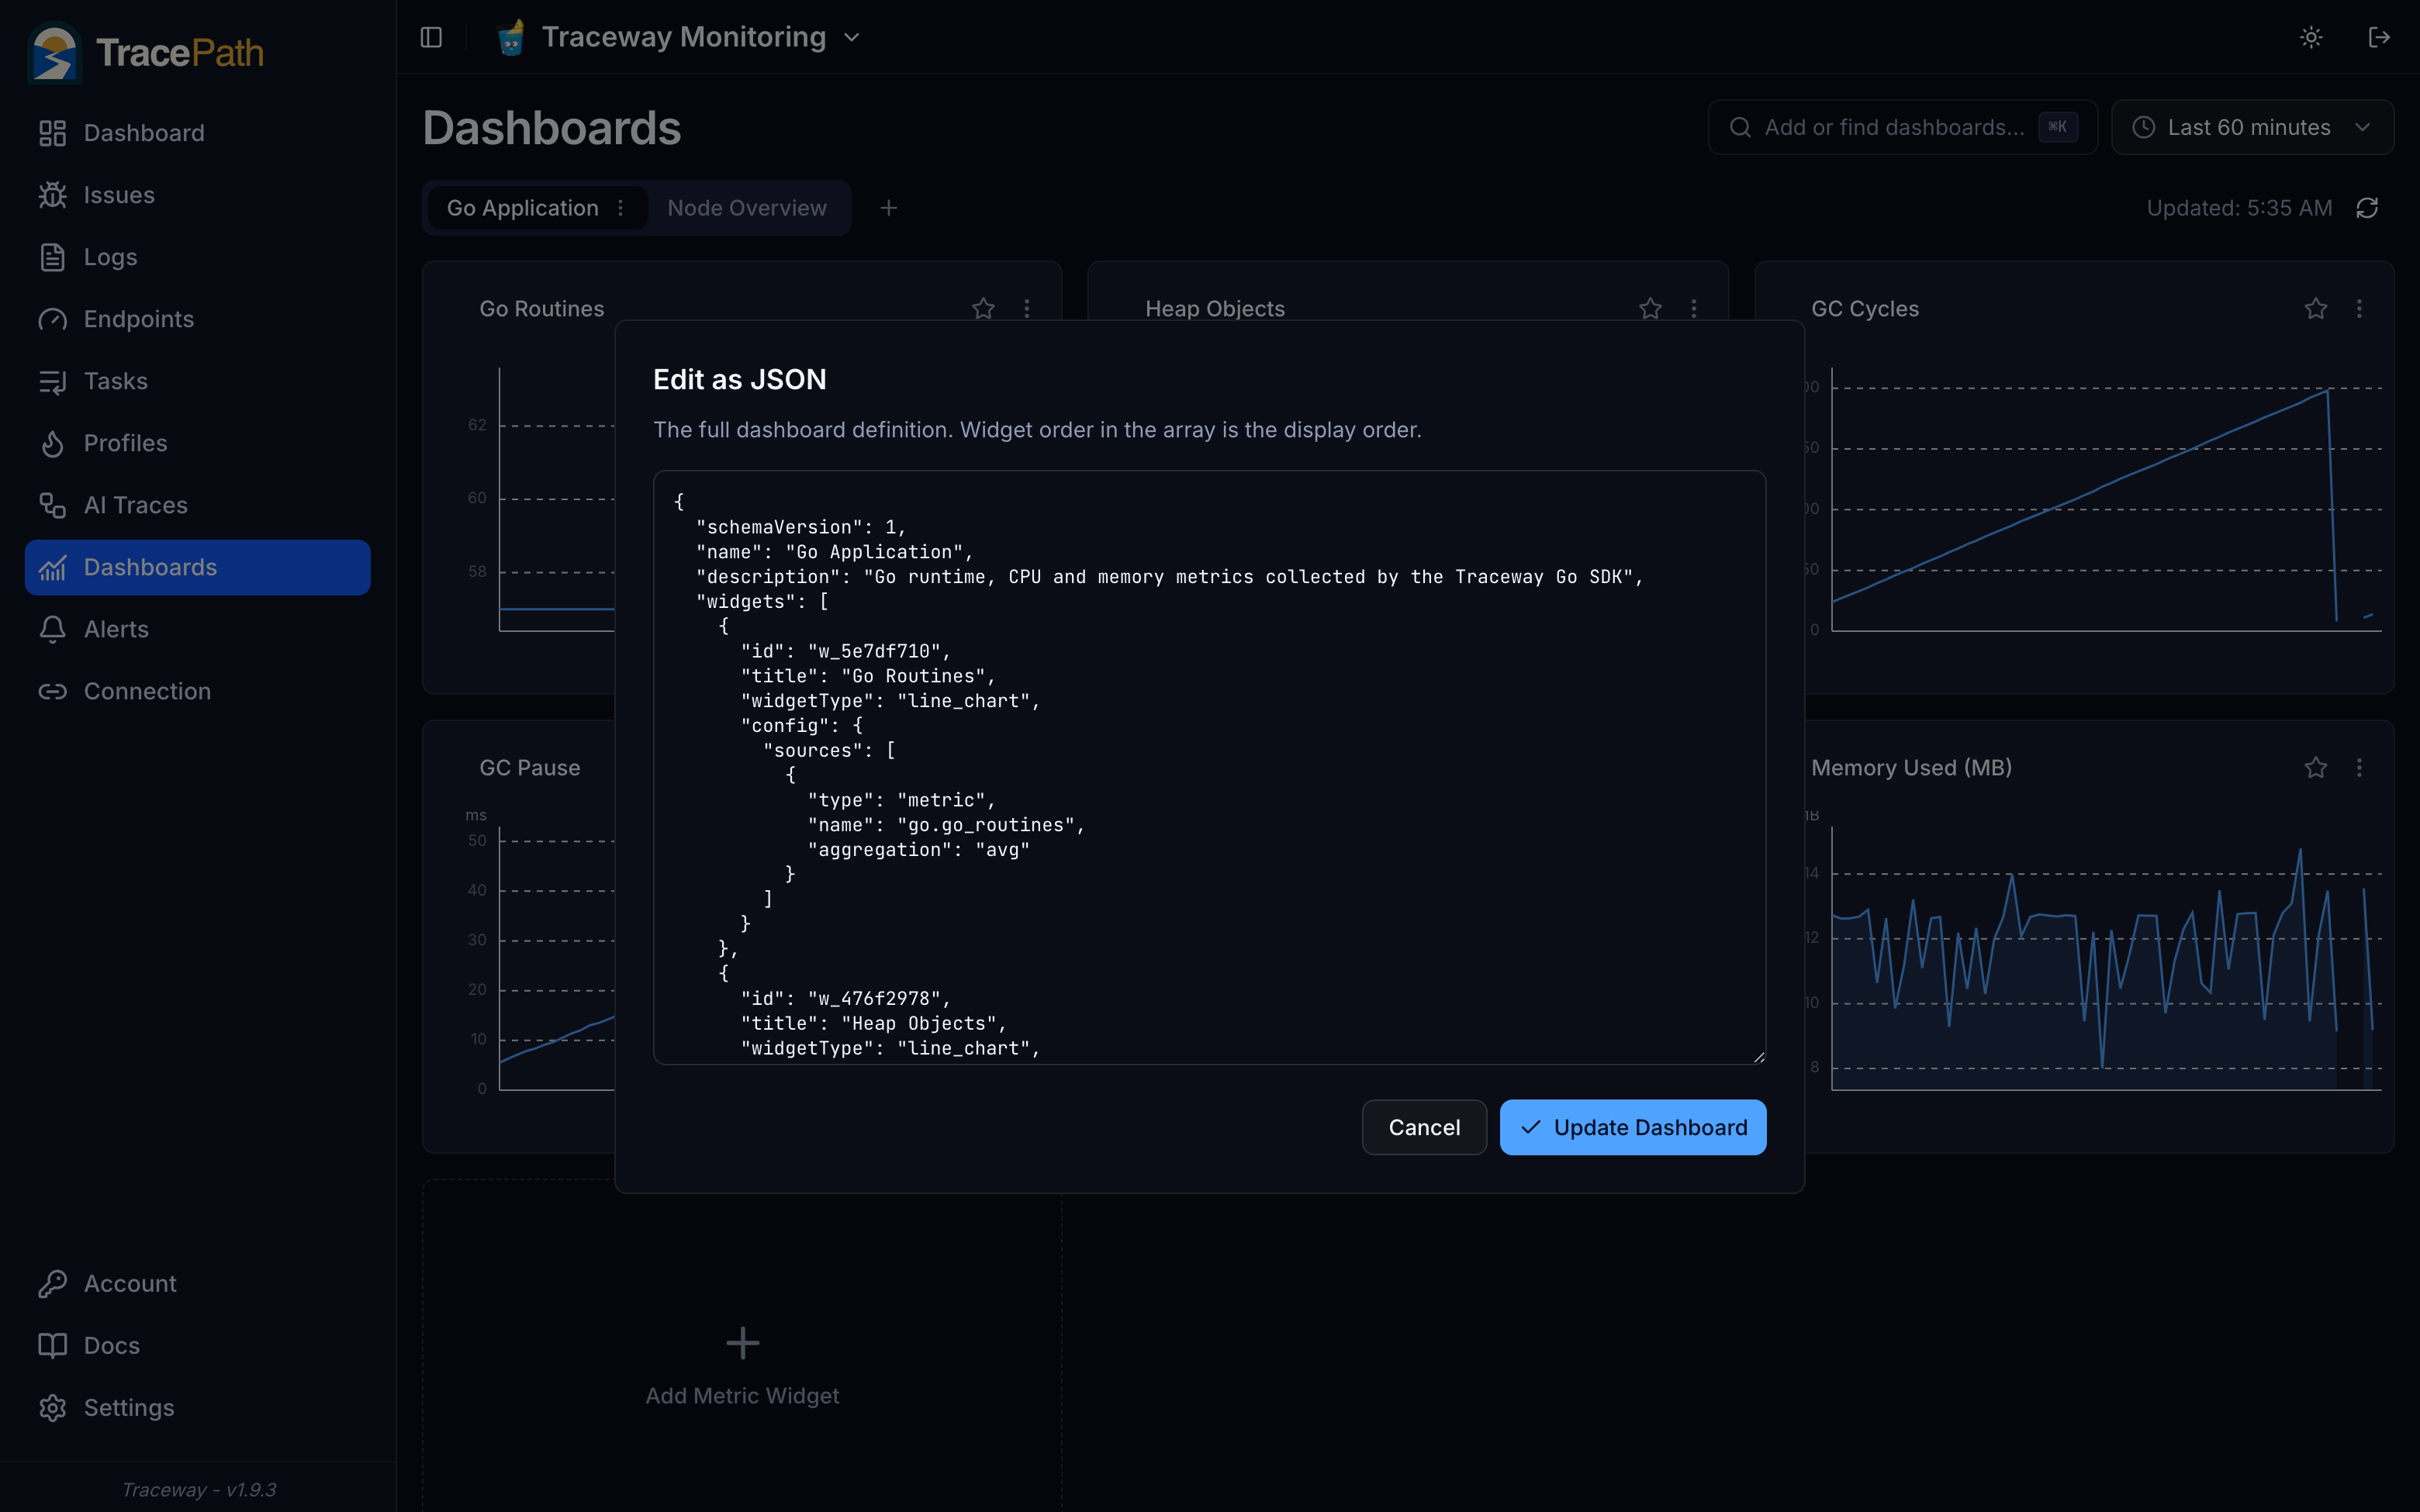
Every dashboard is one JSON document
Widgets, sources, aggregations, and layout live in a single versioned document with a schemaVersion. Edit it in place from the dashboard menu, validated on save, or round-trip it through export and import. Widget ids are stable, so homepage stars survive edits.
- Edit as JSON directly in the UI, validated on save
- Export a dashboard, or your whole organization, as JSON
- Widget order in the array is the display order
- Stable widget ids keep starred widgets intact
Keep dashboards in your repository
The import API has an upsert mode that matches dashboards by name, so a CI job is one curl: POST /api/dashboards/import {"mode": "upsert", "data": ...} with a personal access token. Review dashboard changes in pull requests like any other code, and let the pipeline keep every environment in sync.
- Upsert mode matches dashboards by name, so re-runs are safe
- Import a single dashboard or a whole-organization bundle
- Authenticate with a personal access token from CI
- The UI and the API edit the same document, so nothing drifts
Build once, apply everywhere
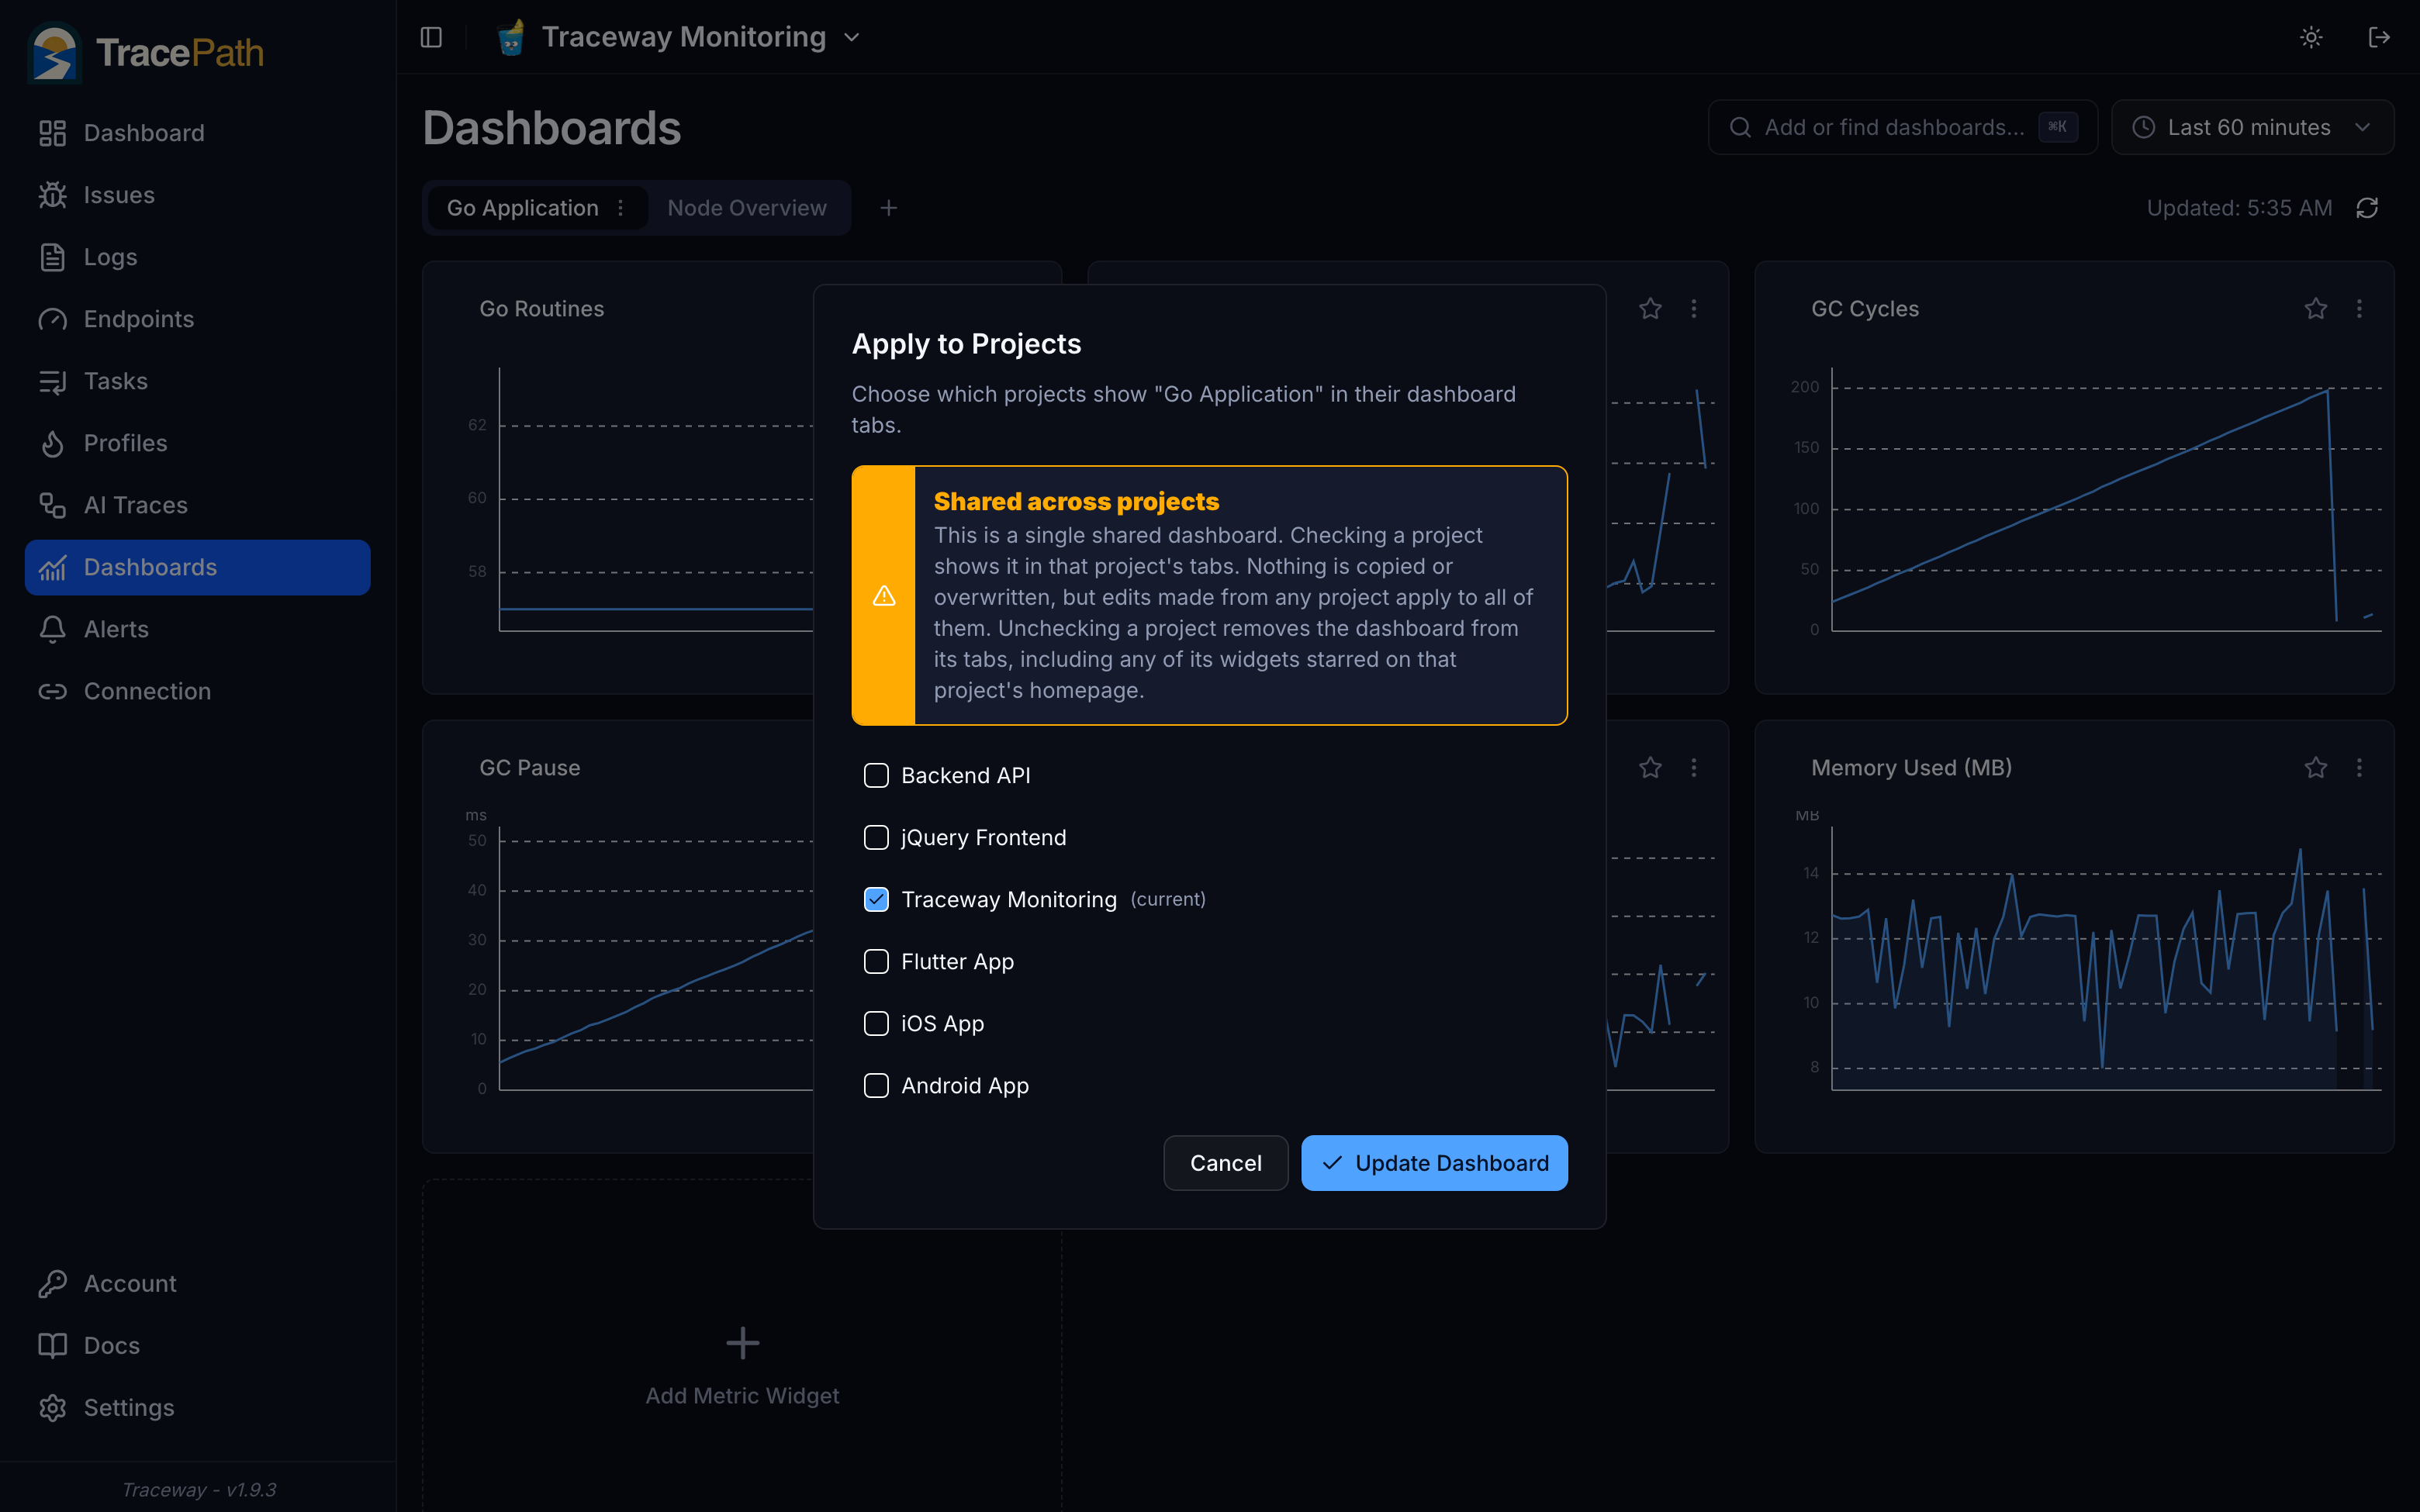
Dashboards belong to your organization, not to a single project. Apply the same dashboard to any set of projects; a fix made in one is instantly live in all of them. Each project still curates its own homepage by starring the widgets it cares about.
- One shared definition, per-project tabs
- Nothing is copied, and edits propagate everywhere
- Per-project starred widgets for the homepage
- Unapplying only removes it from that project's tabs
Bring the Grafana dashboards you already have
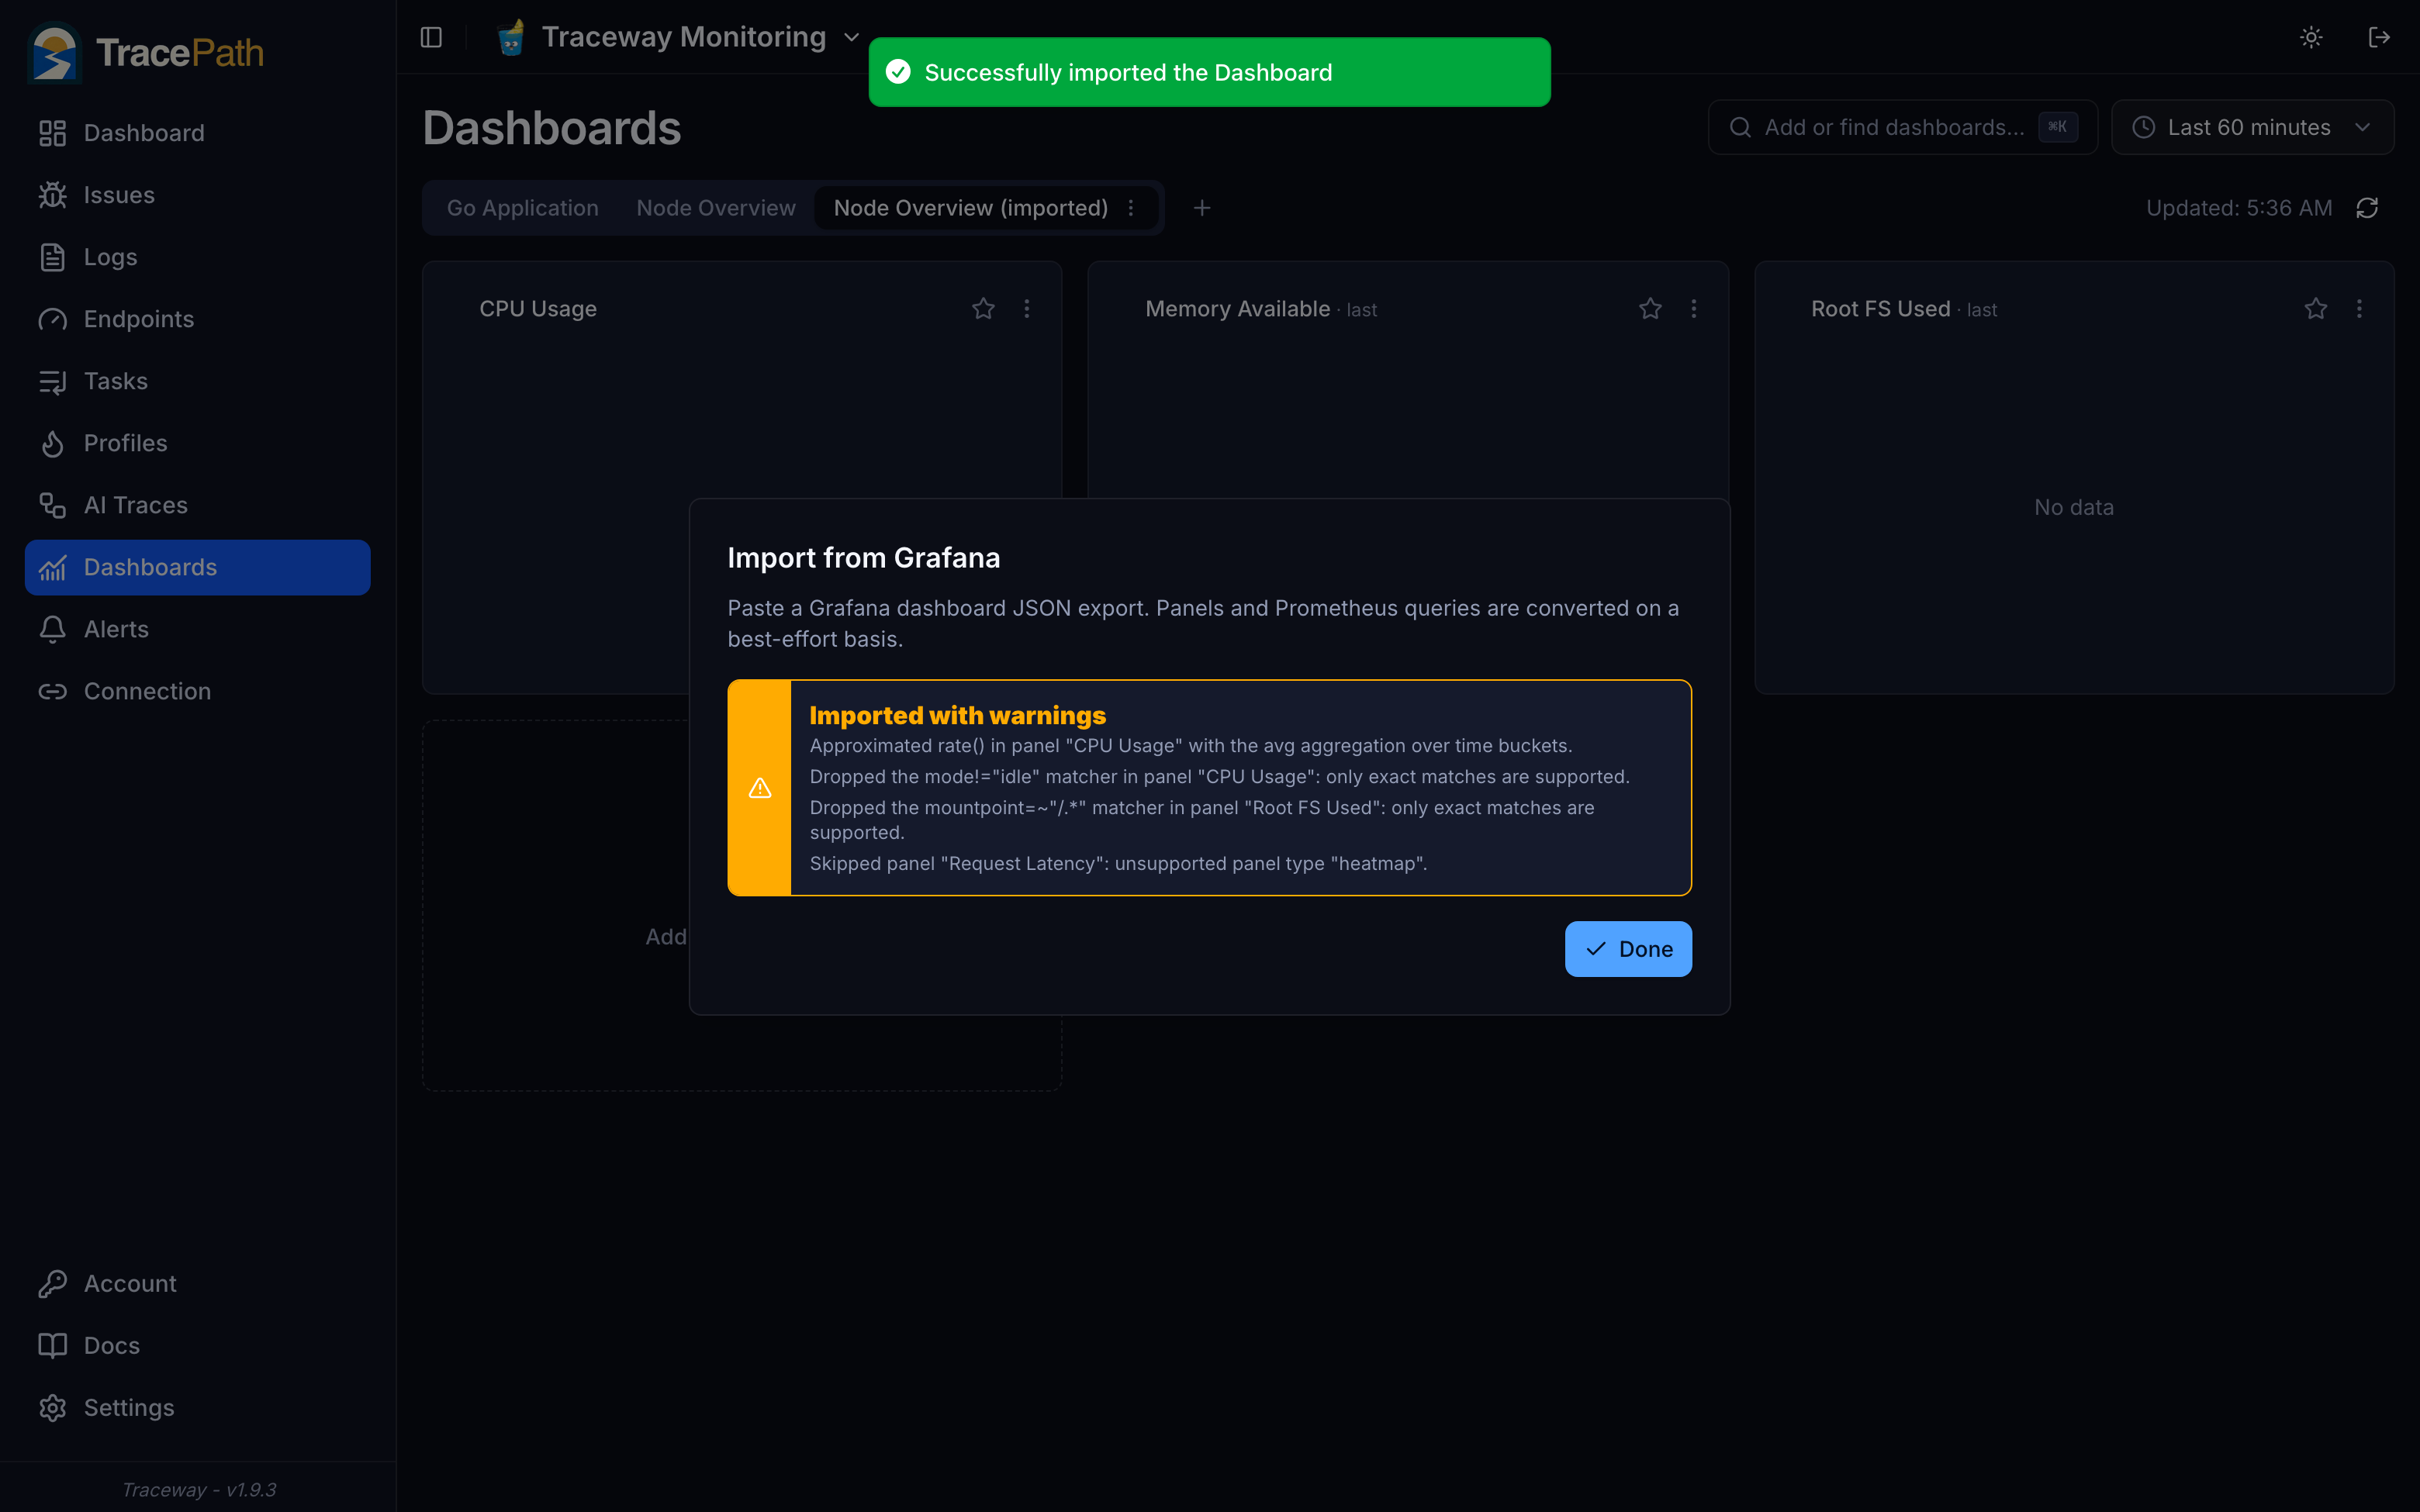
Paste any Grafana dashboard JSON export. Timeseries and graph panels become line charts, stat becomes a single value, gauges stay gauges, and Prometheus queries are unwrapped into metric sources with their label matchers and group-bys. Anything that cannot be converted faithfully is reported, not silently dropped.
- Panels and Prometheus queries converted automatically
- rate() approximations and skipped panels are called out
- Imported dashboards are normal dashboards you can edit freely
Start from a template, find anything fast
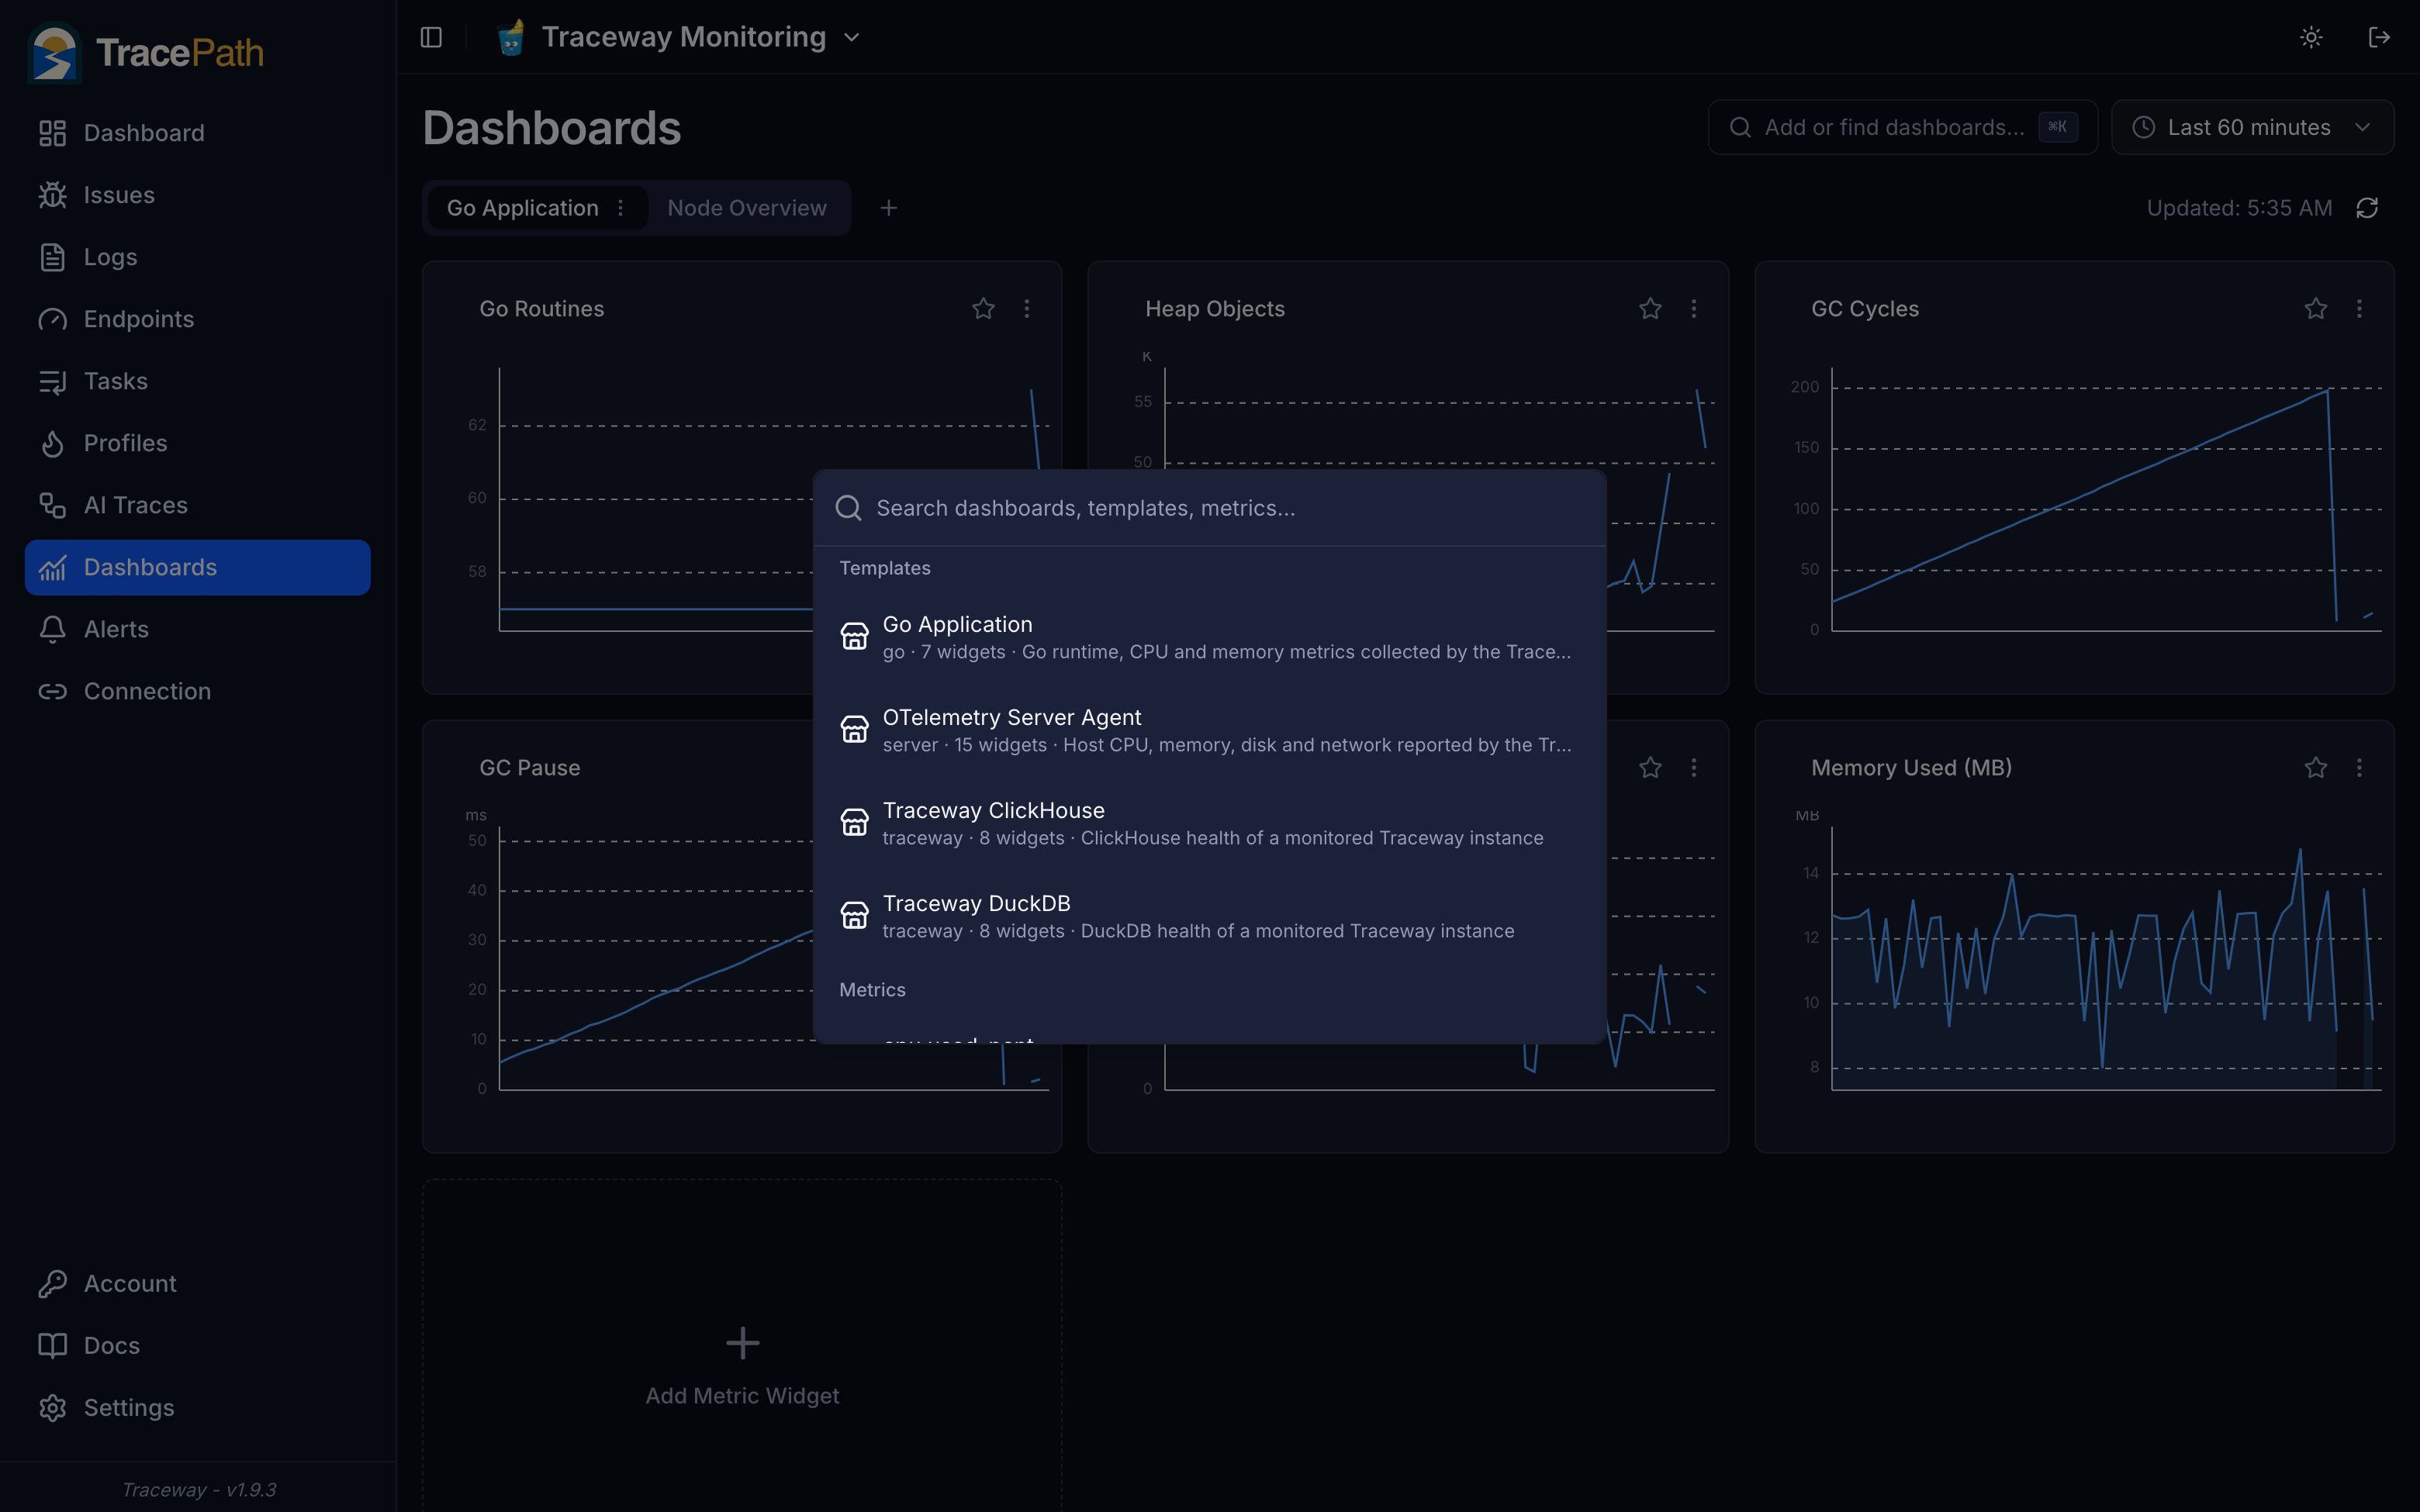
One command palette covers your organization's dashboards, the built-in template marketplace, and every metric name seen across your projects. Install the OTelemetry Server Agent template for host metrics, Go Application for runtime metrics, or ClickHouse and DuckDB health dashboards for a monitored TracePath instance.
- ⌘K searches dashboards, templates, and metrics together
- Templates install as normal dashboards you customize freely
- Selecting a metric opens the widget editor prefilled
Observability dashboards without the click-ops
Plain JSON, org-wide sharing, CI sync, Grafana import. Included on every plan.
Questions about dashboards as code
What does the dashboard JSON look like?
A dashboard is one document with a schemaVersion, a name, and a widgets array. Each widget carries its type (line chart, area, stacked area, bar, single value, gauge, table) and one or more sources: a metric name, an aggregation, optional tag filters, and an optional group-by that splits the chart into one series per tag value. Array order is display order.
How do I sync dashboards from CI?
Export the dashboard once, commit the JSON to your repo, and have CI post it to /api/dashboards/import with "mode": "upsert" and a personal access token. Upsert matches dashboards by name, so the job idempotent. Re-running it converges every environment to the file in your repository.
What happens when someone edits a dashboard in the UI?
The UI edits the exact same JSON document the API serves. There is no separate representation. If you treat your repo as the source of truth, the next CI upsert brings the dashboard back to the committed state; if you prefer UI-first, just export after editing and commit the result.
How faithful is the Grafana import?
Panels and Prometheus queries are converted on a best-effort basis, and every compromise is reported in the import dialog: rate() approximations, dropped regex matchers, unsupported panel types. You end up with a normal TracePath dashboard you can keep editing, never a black box.