Production context, over MCP.
Point any MCP client at your TracePath instance. It logs in over OAuth and starts querying your exceptions, logs, latency, and metrics, directly.
Works with Claude Code, Claude Desktop, Cursor, and any MCP client.
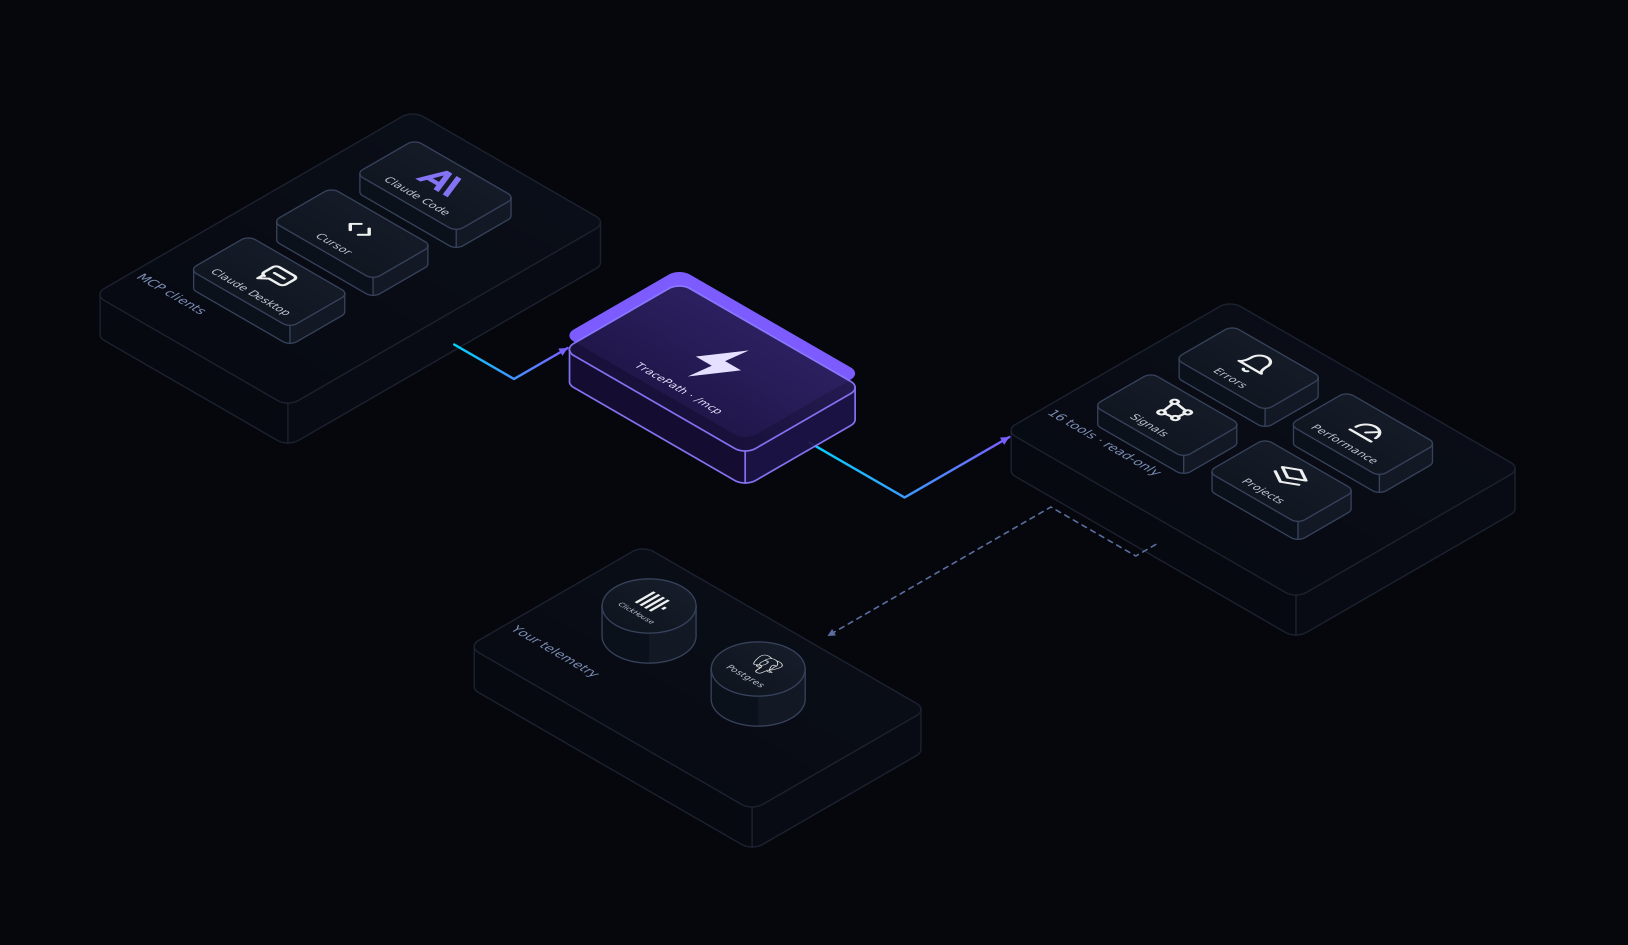
Zero install. Login built in.
Every TracePath backend serves the tools over streamable HTTP at /mcp. On first connect the client registers itself, opens your browser on the instance's consent page, and holds a short-lived access token plus a rotating refresh token. Nothing to install or configure on the host.
- Dynamic client registration (RFC 7591)
- Browser consent on your own instance
- Short-lived access tokens, rotating refresh
- Personal access token fallback for CI
Or run it on stdio
The tracepath CLI doubles as a local MCP server. Log in once in a terminal, pick a default project, and connect over stdio. It reuses your CLI session and refreshes device-login tokens automatically.
New to the CLI? Installation, usage, and login live on the CLI page →
- One binary, no extra daemon
- Reuses your CLI login and current project
- Headless via TRACEPATH_URL + TRACEPATH_TOKEN
- Same tools as the remote server
Sixteen tools. Read-only by default.
Each tool wraps one API call and declares an output schema, so results come back as validated structured content. Only the two archive tools mutate anything, and only when you ask for it by name.
Errors
- list_exceptions
- get_exception
- get_exception_occurrence
- archive_exceptions
- unarchive_exceptions
Performance
- list_endpoints
- endpoints_chart
- get_endpoint_request
- get_slow_endpoint_config
Signals
- query_logs
- query_metrics
- get_task
- get_ai_trace
- get_session
- get_trace
Projects
- list_projects
Safe by default
Every read tool is annotated read-only. Archiving needs an explicit request; investigating an error never touches it.
Prompts and resources
The same investigation playbooks the TracePath skill ships, exposed as MCP prompts (debug_issue, investigate_performance) and knowledge resources.
Your data, your instance
Self-hosted or cloud, the server runs where your telemetry lives. Tokens are scoped to the user who approved the connection.
One protocol, every client
TracePath implements the open Model Context Protocol: streamable HTTP with OAuth for remote, stdio for local. Any spec-compliant client can connect, no plugin required.
Prefer skills over MCP tools? See Agent Skills →
Give your agent a live connection.
Connect an MCP client to your instance and let it investigate the next issue.
Questions about the MCP server
What is the difference between MCP and the agent skills?
The MCP server gives an agent live tools and a login to your instance. The agent skills are Markdown playbooks that drive the tracepath CLI. They share the same knowledge; pick whichever your client supports.
Do I have to paste an API token?
No. The remote server handles OAuth for you: the client registers itself and you approve it in the browser. CI and non-OAuth clients can send a personal access token on the Authorization header instead.
Can an agent change my production data?
Only exception groups can be archived, and only with the archive tools, which are marked mutating and instruct agents to call them solely on explicit request. Everything else is read-only.
Does it work with self-hosted TracePath?
Yes. Every backend serves /mcp, and the OAuth issuer is derived from the request, so it works behind a reverse proxy with no extra configuration.
Which clients are supported?
Any MCP client that speaks streamable HTTP (remote) or stdio (local): Claude Code, Claude Desktop, Cursor, MCP Inspector, and more.