Flutter Session Replay: See What the User Did
 Dusan StanojevicApril 16, 2026
The missing layer of mobile observability. Open source session replay for Flutter: architecture, benchmarks, and everything I ruled out first.
Before we get into it, a few things upfront. I’m the person building TracePath. This isn’t a sponsored post or a polished launch announcement. Everything you’ll see here is open source. If you enjoy this article, the code is available in TracePath and TracePath Flutter Github repos.
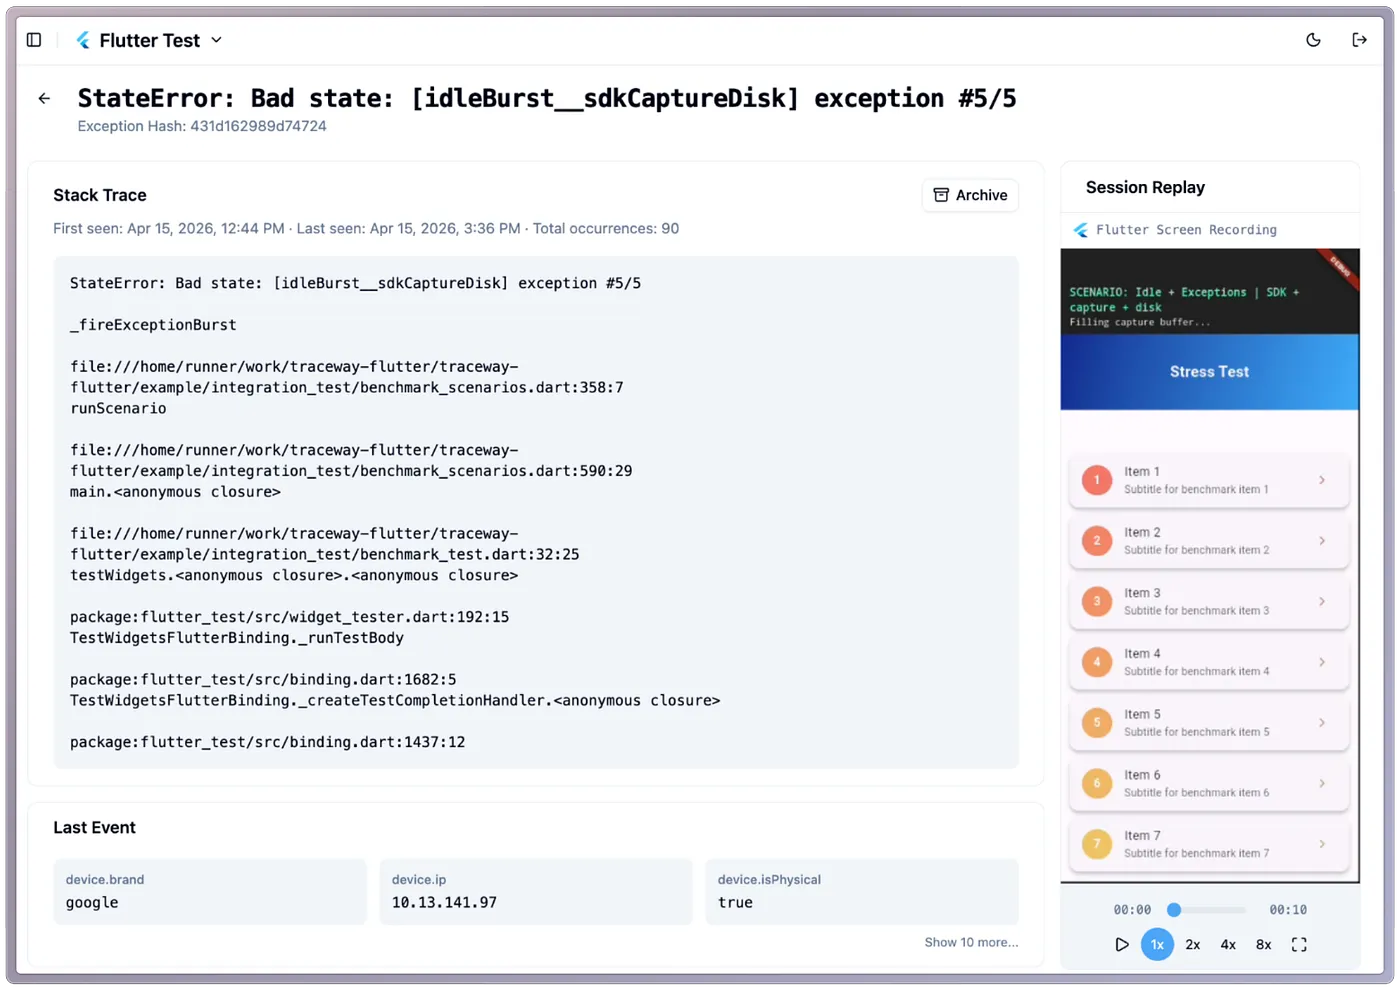
Session replay started as a question I couldn’t let go of: can this be done in Flutter without impacting the performance of the app or your cloud bill in a major way? The answer turned out to be yes.
I’ve been using session replays for web development and they have been incredibly helpful. Logs and stack traces are good but they don’t provide visual context, making it very hard to understand the interactions that led to the issue. Visual context is the missing layer of mobile observability.
There are many tools that offer different types of session replays for native and Flutter apps. None of the options I have seen are affordable, performant, and open source. Almost all seem to be focused on user behavior rather than providing the additional context for stack traces. In this article I’ll explain how I’ve built TracePath Flutter, how it impacts the performance of the app and how it keeps the cloud bills low.
1. What Session Replay Actually Needs to Do
After working through the design constraints, I landed on seven hard requirements:
- capture a meaningful amount of time before the exception has occurred
- be attached to the actual trace with the stack trace of the issue that has occurred
- be playable in the browser
- not degrade app performance
- be affordable at scale
- not impact permissions the user has granted
- work on mobile and desktop devices
2. Ruled Out Approaches
The obvious solution to this problem is to record the full screen and just trim the last 10 seconds and upload that. Unfortunately, this breaks almost every single requirement. Let’s look at different parts of this approach and why some technologies have to be avoided.
2a. FFmpeg On-Device
FFmpeg is an incredible project, it was the first thing I reached for. I’ve used it to record and stream multiple different devices in the past including for an application that allows remote control of a desktop computer. Unfortunately, the FFmpeg library did not work well at all. It was capturing the full screen (not just the app), which required elevated permissions; it also led to higher CPU and battery usage. The replacement for screen recording was to use the RepaintBoundary Flutter widget.
2b. Raw RGBA Frames
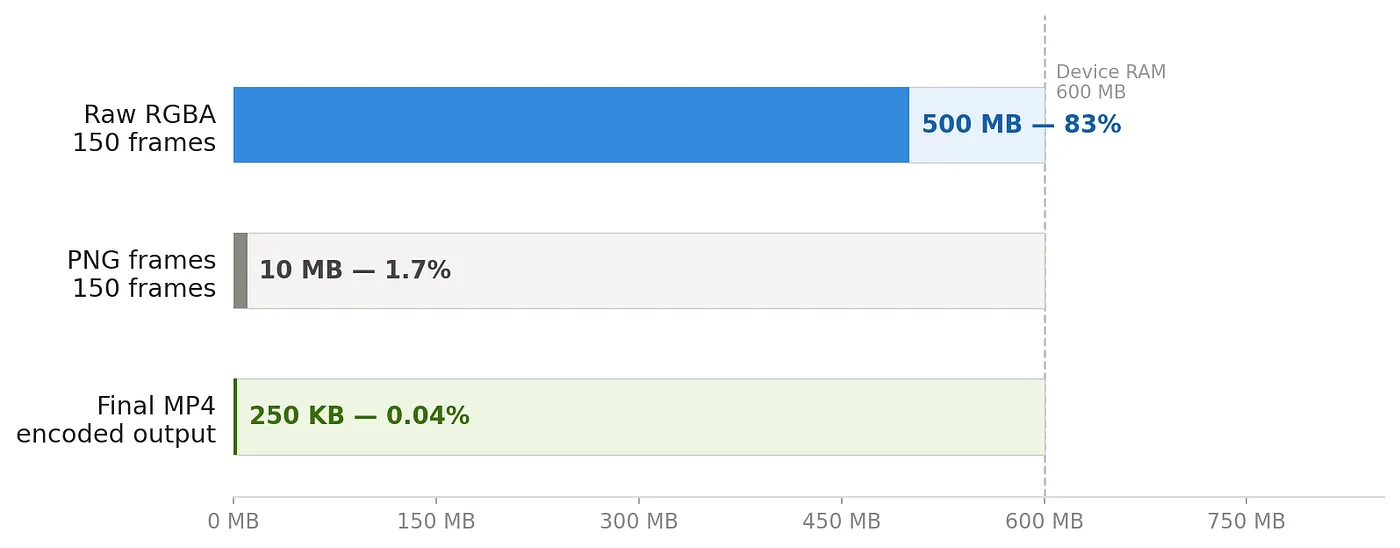
RepaintBoundary was great at exporting the picture of the widgets that it contained. Unfortunately, it did not export users’ interactions (clicks/touches). This made the videos very hard to view. To address this, I decided to just draw user interactions on the frames themselves. This worked, but exporting the RGBA image from the RepaintBoundary led to an in-memory buffer of over 500MB (more about this later) making it unusable. To limit the size of the images the frames had to be stored as PNGs, leading to the memory requirements of ~10MB.
To better show how crippling this is, here is a visualization of the impact it would have on a device with 600MB of RAM:
2c. Platform Channel Video Recording
Using native iOS/Android screen recording APIs via platform channels was unfortunately not an option due to permissions friction and no access to Flutter widget tree for redaction.
3. The Architecture That Works
The system has four layers: capture, buffer, encode, and sync. During normal operation only the first two are active.
The TracePath widget wraps your app in a RepaintBoundary and a Listener. Every 67 milliseconds, the ScreenRecorder calls toImage() on the RepaintBoundary, converts the result to PNG bytes, pairs it with the current touch position and any active privacy mask regions, and pushes the frame into a circular buffer of 150 slots. When the buffer is full the oldest frame is silently overwritten. That’s the entire cost of normal operation: a timer, a screenshot, and a buffer write.
When an exception occurs, three hooks funnel the error into the TracePathClient: FlutterError.onError, PlatformDispatcher.onError, and runZonedGuarded. The client formats the stack trace, collects device metadata, writes the exception to disk, and triggers encoding. The ScreenRecorder drains the circular buffer, decodes each PNG back to raw pixels, applies privacy masks and touch indicators, and feeds the frames one at a time into a H.264 encoder. An encoding lock ensures only one encode runs at a time, so rapid exception bursts don’t stack up. The resulting MP4 gets attached to the exception payload and the exception payload gets sent to the server.
Once encoding completes, the sync layer waits 1.5 seconds to batch any concurrent exceptions, compresses the payload, and POSTs it to the TracePath server. On success the local files are deleted. On failure it retries after 10 seconds. If there is no network, the files sit on disk, capped at 5 files and 12 hours (configurable with a parameter), and sync automatically when connectivity comes back.
3a. RepaintBoundary: The Capture Layer
RepaintBoundary is a Flutter Widget that is the backbone of the screen recording. It has a function toImage() that exports the snapshot of the widget tree without using the screenshot API, meaning no new permissions are needed. This approach is Flutter native and captures only what the engine has already rendered.
The downside of the RepaintBoundary is that it does not record user interactions, so pointer events are not visible. To show the pointer events we added a listener that wraps the widget.child before passing it to the RepaintBoundary, allowing us to understand interactions with the app.
RepaintBoundary(
  child: Listener(
    onPointerDown: _onPointerDown,
    onPointerMove: _onPointerMove,
    onPointerUp: _onPointerUp,
    child: widget.child,
  ),
);
After we call toImage() we “enhance” the image by adding user inputs to the image (if any touch events are active) and we also blur out parts of the image containing the data that should be masked (more about this in the Privacy & Redaction section).
3b. The Scale Factor and FPS Decision
To meet the performance requirements, primarily to limit the memory footprint, we set the default scale factor of 0.75 and the default FPS at 15. This tradeoff is possible because complex animations don’t matter much when analyzing the users’ actions. We’re always keeping 10 seconds of snapshots at 15 FPS, which leads to a total of 150 frames in memory (even when no exceptions have taken place). Each frame is a PNG at 0.75 scale factor. UI screenshots compress heavily (mostly flat colors), typically 30–80KB per frame, so 150 frames ≈ 5–12MB. At encode time, only one raw frame (~5MB) is ever in memory. Scale factor and the FPS are adjustable through the TracePath widget setup API.
3c. Storing The Recordings
To further limit the memory usage of the application and to make exceptions durable, we don’t keep exceptions and recordings in memory. Instead, we write them to the device’s storage. If no network is available, recordings sync when connectivity is restored. We limit the number of recordings and how long they are stored. Both limits are parameters of the TracePath init that can be optimized.
3d. CPU: Encoding on Exception Only
The key to keeping the CPU usage low is to only encode when the exception happens. Because exceptions are not frequent, the overhead of encoding is nonexistent. The Benchmarks section covers MP4 encoding overhead in detail. During normal operation the CPU cost is negligible. The app is only capturing screenshots and storing PNGs.
4. Storage Architecture & Cost
To lower the costs TracePath stores videos in an S3-compatible storage. On my personal device (iPhone 17 pro max) the recording came out at 250KB for 10 seconds, meaning 1TB of S3 Standard storage, costing around $23/month, holds approximately 4 million recordings. MP4 is extremely efficient with this content because the frames in most apps are similar to one another.
5. Privacy & Redaction
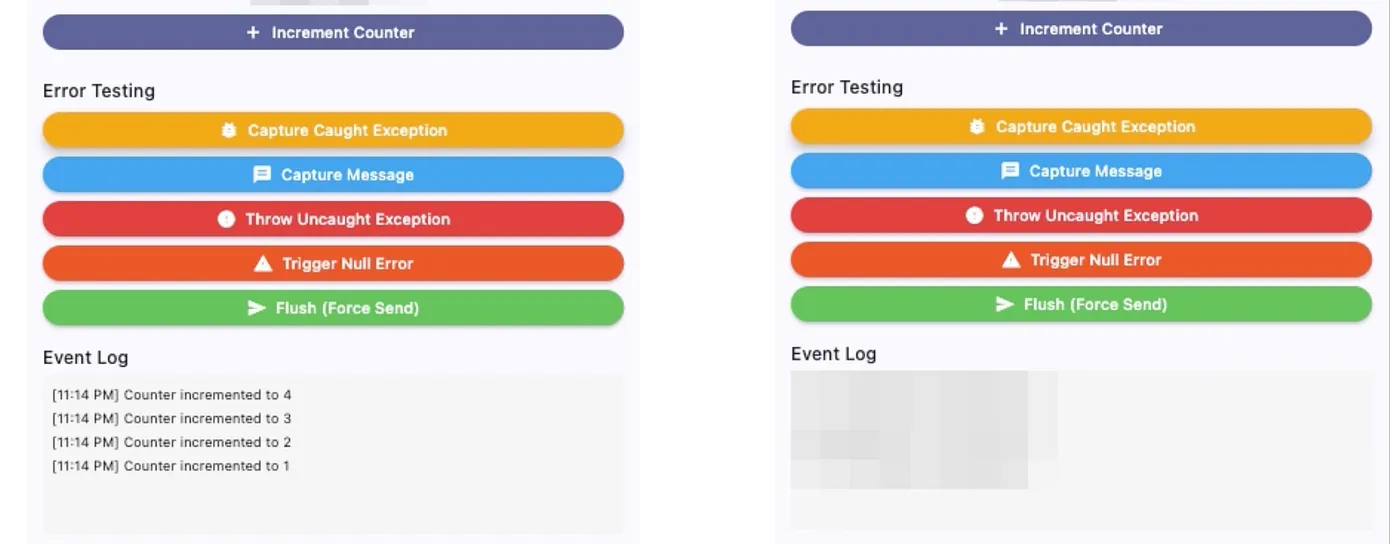
Some applications need to have the ability to opt out of having some of their data captured. To mask a widget in the video we use the TracePathPrivacyMask widget, it blurs the content by default but can also fully hide it by passing in the mode parameter (e.g. TracePathMaskBlank).
TracePathPrivacyMask(
  child: Text('Counter: $_counter'),
)
// or

TracePathPrivacyMask(
  mode: TracePathMaskBlank(),
  child: Text('Counter: $_counter'),
)
6. Developer Experience
Integration is straightforward. Developers wrap their application in the TracePath widget with their desired configuration. The default configuration is recommended as it has a great balance between costs, performance and quality. This is enough to get all exceptions and session replays sent to the TracePath server.
TracePath.run(
  connectionString: 'your-token@https://cloud.tracepath.dev/api/report',
  options: TracePathOptions(
    screenCapture: true,
    version: '1.0.0',
  ),
  child: MyApp(),
);
This library can be used with MacOS, iOS and Android. For Flutter web projects the JS SDK should be used, see Flutter Web.
7. Full Benchmark Summary
The table below consolidates every measurement from the benchmarks discussed throughout this article. The full benchmark can be found here. Metrics marked with a dagger (†) are engineering estimates derived from code constants rather than automated harness output, encoding time, upload latency, and cost-per-session instrumentation are planned additions to future harness iterations.
I designed the benchmark workloads to mirror how people actually use mobile apps, not synthetic stress tests. The scenarios: idle rendering, list scrolling, page navigation, and video playback each have a dedicated burst variant that fires five exceptions in rapid succession. A standalone exception burst scenario covers the full-interaction flow and serves as the de facto full-interaction burst. Each scenario runs under four SDK configurations: no SDK at all (the baseline), SDK with error capture only, SDK with screen recording at 15 FPS, and the full stack with disk persistence enabled. This four-level matrix lets us isolate exactly where overhead comes from: the error hooks themselves add virtually nothing, the 15 FPS capture loop adds 14–29 MB of memory in steady-state idle conditions (other scenarios vary due to GC timing) and zero measurable frame-time regression, and disk persistence adds a small incremental cost on top. Importantly, the frame build p50 with TracePath enabled is consistently at or below the baseline, the capture timer doesn’t compete with the render pipeline, so the "below the baseline" can be attributed to regular testing noise.
I ran all Android tests on Firebase Test Lab across three device tiers: Pixel 5 (API 30, representing low-end), Pixel 6 (API 33, mid-range), and Pixel 8 (API 34, flagship), providing coverage from budget hardware to current-generation silicon. iOS benchmarks on iPhone 8 (iOS 16.6), iPhone 13 Pro (iOS 17.5), and iPhone 15 Pro (iOS 18.0) are planned and will be added to the harness in a future iteration. The results presented in this report are Android-only. I measured frame timing using Flutter’s built-in FrameTiming callback (build + raster durations, p50/p90/p99/max), sampled memory via ProcessInfo.currentRss and peak RSS, and timed exception capture cost as wall-clock microseconds around each captureException call.
Each scenario ran as a Flutter integration test inside the example app, driven by testWidgets, with a settle window after exception bursts (10 seconds for most scenarios, 3 seconds for the video playback burst) to let encoding and sync complete before I finalized the metrics.
Based on these numbers this approach is safe to run in production with screen recording enabled. There is no frame-time regression at p50 on any device tier, jank counts are flat during normal operation (and often lower than baseline), and memory overhead is bounded and predictable. During exception burst scenarios jank does increase, up to 3x on lower-end devices, which is expected given the encoding work triggered at that moment. Even in the worst case (an exception burst on the Pixel 8, the highest-memory scenario at +69.5 MB), peak RSS stays under 70 MB above baseline. That said, the harness doesn’t yet automate encoding wall-clock time, upload latency, or cost-per-session metrics, and those are on the roadmap.
I took ideas from the FlutterDev community, implemented them, and ran them through the benchmark harness. Some moved the needle, some didn’t. The original post and discussion are linked here.
This is where you come in: if you think you can do better, open the PR. If you have ideas for reducing the memory footprint, speeding up PNG capture, or optimizing the H.264 encoding path, implement it and open the PR, I’ll trigger the CI and we will see exactly what changed, on real hardware, before anything gets merged. I built this infrastructure specifically so that performance claims are backed by data; every improvement (or regression) is measured and visible.
8. Conclusion
Session replay for Flutter is a solved problem, but only if you’re willing to pay for a closed-source SaaS tool that treats observability as a premium feature. TracePath was built on the premise that it doesn’t have to be that way.
RepaintBoundary capture, deferred MP4 encoding, S3-compatible storage, and a circular frame buffer together prove that you can have meaningful visual context around your exceptions without sacrificing frame time, bloating memory, or surprising your users with new permission prompts. The benchmarks back this up: zero measurable frame-time regression across multiple real devices, predictable memory overhead, and storage costs that stay flat even at scale.
The harness has gaps. It doesn’t yet measure encoding wall-clock time or upload latency end-to-end, and there are likely optimizations left on the table in the PNG capture and H.264 encoding paths. This is exactly why it’s open source.
If you see something that can be done better, open a PR. Every change gets measured on real hardware before it merges, no “it felt faster.” Either the numbers improve or they don’t.
The next goal is equivalent implementations for iOS, Android, and React Native. If you work in any of those ecosystems and want to take a swing at it, reach out or open an issue. I’d rather build this together than alone.
Special thanks to: u/chimbori, u/__o_-_o__, u/Deep_Ad1959, u/g0rdan and everyone else from the FlutterDev community on Reddit, whose feedback directly shaped several of the optimizations described here.
The code is available in the TracePath and TracePath Flutter repositories. You can also reach out directly by sending me an email at [email protected] or adding me on LinkedIn.