SQLite vs DuckDB: every read cliff moved 100x
Same $16.49/month box, same binary, two embedded databases. DuckDB wrote 4x to 15x faster than SQLite and moved every dashboard read cliff by 100x.
Two embedded databases, one machine, one codebase. The TracePath backend keeps telemetry behind a storage interface, which makes it possible to swap the engine underneath and change nothing else — so we ran the same benchmark suite against the SQLite storage backend and the DuckDB one on identical hardware. DuckDB wrote between three and fifteen times faster depending on the signal, and served real dashboard pages at exactly one hundred times the row count for all three signals. This post is the method and the numbers.
Key takeaways
| SQLite | DuckDB | Change | |
|---|---|---|---|
| Metrics writes | 61,712 pts/sec | 254,242 pts/sec | 4x |
| Spans writes | 30,508 spans/sec | 95,737 spans/sec | 3x |
| Logs writes | 4,877 rec/sec | 75,225 rec/sec | 15x |
| Metrics read cliff | 1M rows (3.85 s median) | 100M rows (3.0 s median) | 100x |
| Spans read cliff | 100k rows (2.27 s median) | 10M rows (902 ms median) | 100x |
| Logs read cliff | 100k rows (114 ms median) | 10M rows (85 ms median) | 100x |
A read cliff, throughout this series, is the largest table size at which real dashboard pages still load: the median of three endpoint probes at or under 5 seconds, none timing out. It earns the name because of what sits one 10x step past it. Queries do not get slower, they stop coming back.
Each signal's read cliff sits exactly 100x further out on DuckDB than on SQLite, at equal or better latency, on identical hardware. That symmetry was checked against the raw result files twice before anyone believed it. The same box also ingested a billion metric points in under an hour into 10.8 GB of disk and stayed up, a scale the SQLite runs never got within 100x of. Logs — the signal the SQLite benchmark said to keep off the box entirely — are DuckDB's biggest win.
What is actually being compared
The earlier post in this series, I tried to break SQLite, ended promising a ClickHouse comparison, and that comparison is still worth running. But a question keeps getting in front of it: before reaching for a client-server OLAP database, with its own container, its own memory appetite, and its own failure modes, how far does an embedded one go?
TracePath's backend builds with a DuckDB telemetry store as an alternative to the SQLite one — same single binary, same relational database, a different storage engine under the telemetry tables. Between those two, on one machine, the trade is not obvious and nobody seems to have published numbers for it. So the earlier post's entire methodology was rerun against the DuckDB build and the results put side by side.
The order below: methodology first, including what changed in the harness and one fix in the backend itself that these numbers depend on. Then writes for all three signals against their SQLite baselines. Then reads, same shape. Then the billion-row run, what queries cost past the cliffs, what a real fleet consumes on each build, and which engine we would actually put behind which workload.
How it was measured
The setup carries over from the previous post, so this is the short version. A system under test running the TracePath binary and a separate load generator on a private link, both in the same datacenter. OTLP — the OpenTelemetry wire protocol — over gzipped protobuf. Uniform-random data in bounded ranges. Ubuntu 24.04, retention disabled for the duration.
Two scenarios per signal.
The throughput ramp: a batch-size ramp at fixed rate, then a request-rate ramp at the winning batch size (this time with a finer ladder, 1 through 25 requests/sec, because the interesting cliffs turned out to sit between the previous run's coarser steps), then a small-batch high-rate ramp shaped like a fleet of SDKs. A step passes at under 5% errors and at least 70% of target rate achieved.
The read probe: fill the table to 1M, 10M, 100M, 1B and then 5B rows, and at each level load three real dashboard endpoints for that signal. A level passes when the median is at or under 5 s and nothing hits the 6 s timeout. The 5-second bar is generous on purpose, for the reason the earlier post gave: a dashboard that takes five seconds is already a bad dashboard, so a threshold there measures the outer edge of usable rather than the edge of pleasant.
Three things differ from the previous harness, all disclosed:
- The load generator grew. It used to be an identical CCX13, which SQLite's ceilings never stressed. On the first DuckDB spans run, the generator died mid-ramp while the database sat at 0% errors — the traffic generator broke before the thing it was supposed to break. It is now a CCX23. The system under test, the box every number here describes, is unchanged.
- A digestion gate was added. DuckDB checkpoints its write-ahead log after ingest stops; probe during that window and you measure a busy engine rather than a query. The read probe now polls the backend's deep-health endpoint until the database and WAL file sizes are stable, records the wait per level (5 seconds at every level in the final runs), and only then probes. The SQLite backend reports no engine gauges and skips the wait, so its earlier numbers were produced identically.
- Only accepted rows count. A fill counts items confirmed by 2xx responses, not items attempted, which matters once the backend learns to refuse work. Fills overshoot their targets — at the smallest level by as much as 2.6x — so actual row counts are quoted wherever the difference matters.
Caveats. These are single-shot runs: one throughput run and one read ladder per signal. The previous post promised medians of three repetitions starting here, and that is walked back one more time, because the fix-and-rerun cycle described below consumed the budget. The key cells did reproduce across the debugging runs — 100M metrics reads landed between 2.7 s and 3.2 s across four runs on different days — but the protocol is single-shot. "Passing" means three named endpoints on freshly written data on an otherwise idle box. Read-under-ingest remains future work.
One more disclosure, this one in the backend rather than the harness. The first DuckDB runs produced numbers that could not be trusted: the box kept dying mid-benchmark, and the hunt led to a real bug in the ingest path, which had no admission control and let a sustained burst of fat batches run the process out of memory. The fix was an ingest gate that caps concurrent processing and answers overload with 503 plus Retry-After. Every number in this post comes from the fixed backend. The pre-fix results understate DuckDB — spans by 23% and logs by almost half — because the crashes were cutting the ramps short. SQLite never surfaced the bug: its slower insert path errors early under pressure, which is the previous post's 5 requests/sec logs wall doing its job.
Writes: 4x, 3x, 15x
| Signal | SQLite | DuckDB | Winning shape (DuckDB) | Lowest failing step |
|---|---|---|---|---|
| Metrics | 61,712/sec | 254,242/sec | batch 16384 × 20 req/sec, p50 3.2 s | 22.5 req/sec, 12.2% errors |
| Spans | 30,508/sec | 95,737/sec | batch 16384 × 7.5 req/sec, p50 1.2 s | 8.75 req/sec, 9.7% errors |
| Logs | 4,877/sec | 75,225/sec | batch 16384 × 5 req/sec, p50 3.0 s | 5.625 req/sec, 11.4% errors |
The bar going in was "double SQLite and call it a win", and the cell to brace for was logs. The previous post's starkest result was logs writing at 4,877/sec into a wall at 5 requests/sec so sharp that 1.5x more requests took the error rate from 0% to 98%. That wall is the cell that moved most: the DuckDB build writes logs at fifteen times SQLite's rate, and the wall becomes a slope of polite refusals. The signal with the lowest SQLite ceiling and the highest real-world volume is the one the columnar engine helps most — obvious in hindsight, and the opposite of what the SQLite results had trained us to expect.
The "lowest failing step" column matters as much as the headline one, and lowest is the right word: the ladder bisects between the last passing and first failing rate, so those are the smallest rates that fail, not the first failures in wall-clock order. Every failure in that column is the backend refusing work rather than falling over. The run logs show 503s from the admission gate, the archived results show zero insert failures and zero dropped rows behind them, and the container finished all three runs with zero restarts. That is the same graceful-cliff behaviour SQLite showed earlier, and DuckDB only exhibits it because of the fix disclosed above; before it, this table could not be produced at all.
The bottom of each ramp holds one more first for the series: the fleet shape, hundreds of small batches per second rather than a few fat ones, which the earlier post could only measure on SQLite. DuckDB sustains 53,091 metric points/sec, 36,577 spans/sec and 30,442 log records/sec at batch size 100. The pre-fix backend died before that phase of the ramp could run, so those numbers appearing at all was the first sign the reruns were measuring something the crashes had been eating.
Reads: every cliff, 100x later
Writes were the appetizer. Reads are why anyone reaches for a columnar engine.
| Fill level | Metrics | Spans | Logs |
|---|---|---|---|
| 1M | 146 ms | 139 ms | 27 ms |
| 10M | 382 ms | 902 ms | 85 ms |
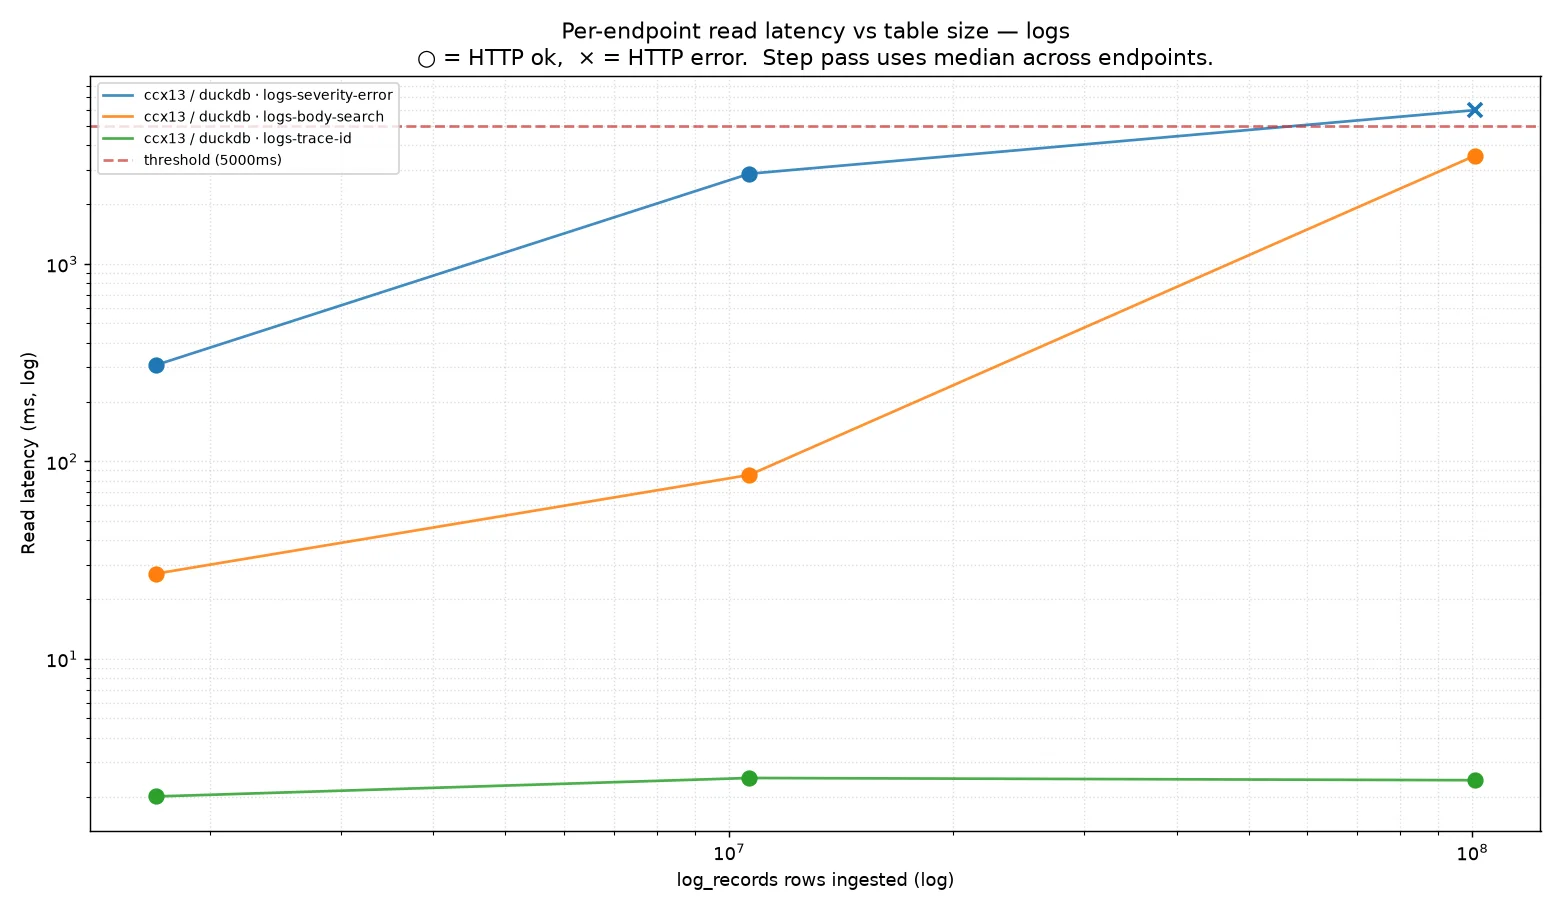
| 100M | 3.0 s, passes | over 60 s, fails | fails unevenly: body search 3.5 s, trace-id 2 ms, severity filter over 60 s |
| 1B | fill succeeds, queries over 60 s | not reached | not reached |
Each cell is the median of three real endpoint probes after fill and digestion; bold marks each signal's last passing level. Two footnotes on the table itself. The levels are fill targets and the fills run over — the 1M level actually holds 1.7M rows for spans and logs and 2.6M for metrics, and every level above lands within 16% of target. And the over-60-second durations come from a second ladder run with the probe timeout raised to 60 seconds, which gets its own section below; the standard probe gives up at 6 s.
The expectation was 10x per signal. It was 100x for all three: SQLite's last passing levels were 1M, 100k and 100k, and every one moved by the same factor of one hundred. Same endpoints, same thresholds.
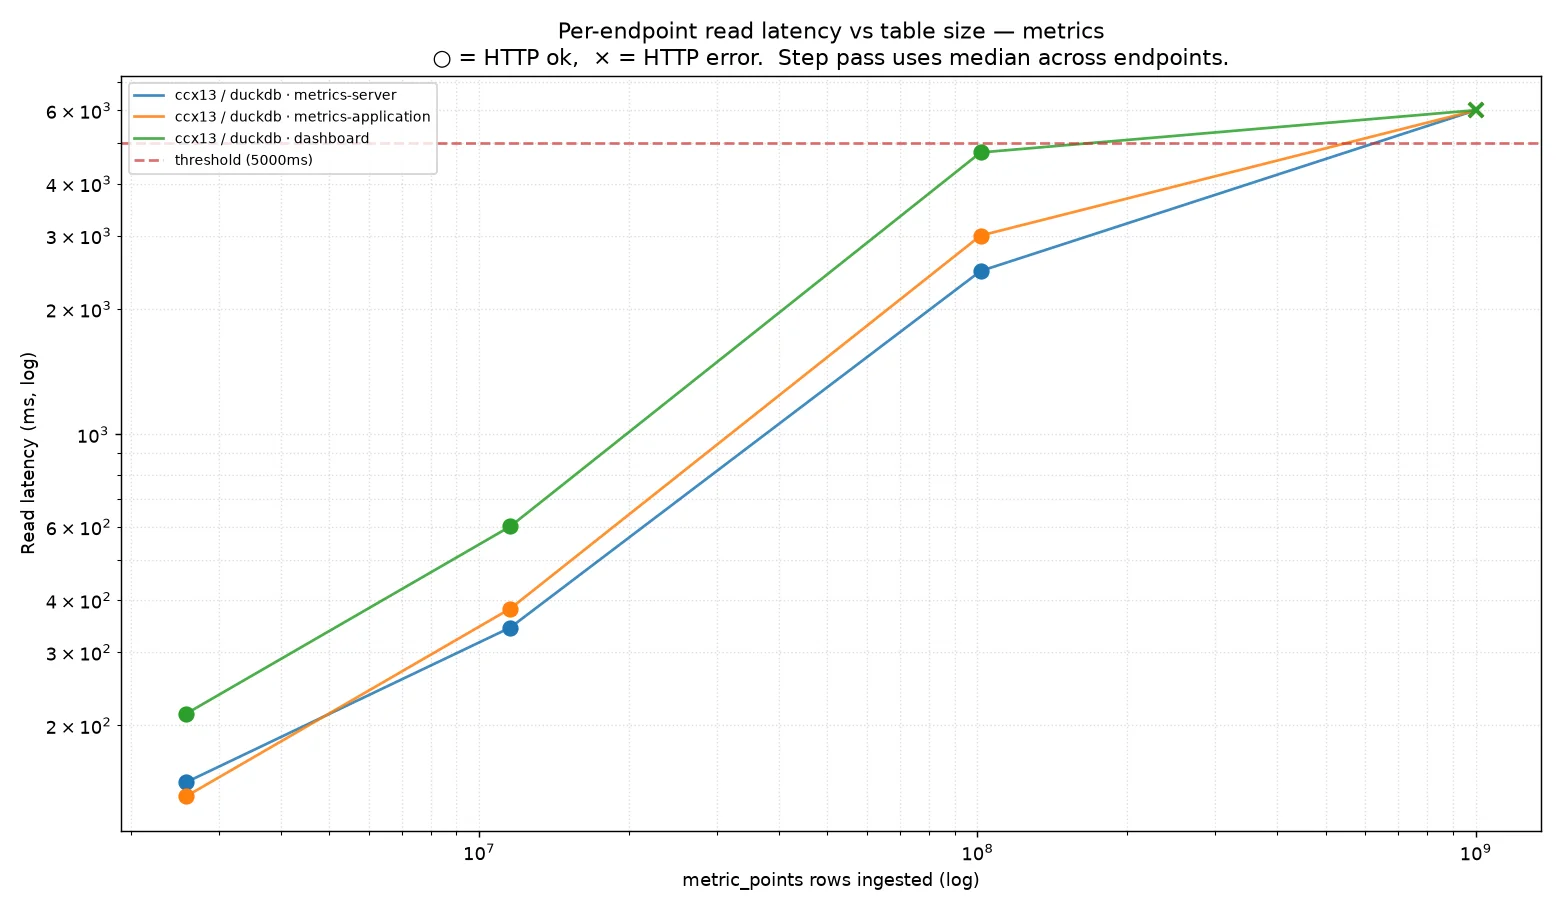
Metrics reads scale gently: 146 ms at 1M, 382 ms at 10M, 3.0 s at 100M. A hundred times the rows costs twenty times the latency — the scan gets cheaper per row as the table grows. The level SQLite barely passed is a hundredth of the level DuckDB passes with the same margin.
Spans pay for their percentiles, same as on SQLite, just later. This is the page doing the paying, rendered over the load generator's spans:
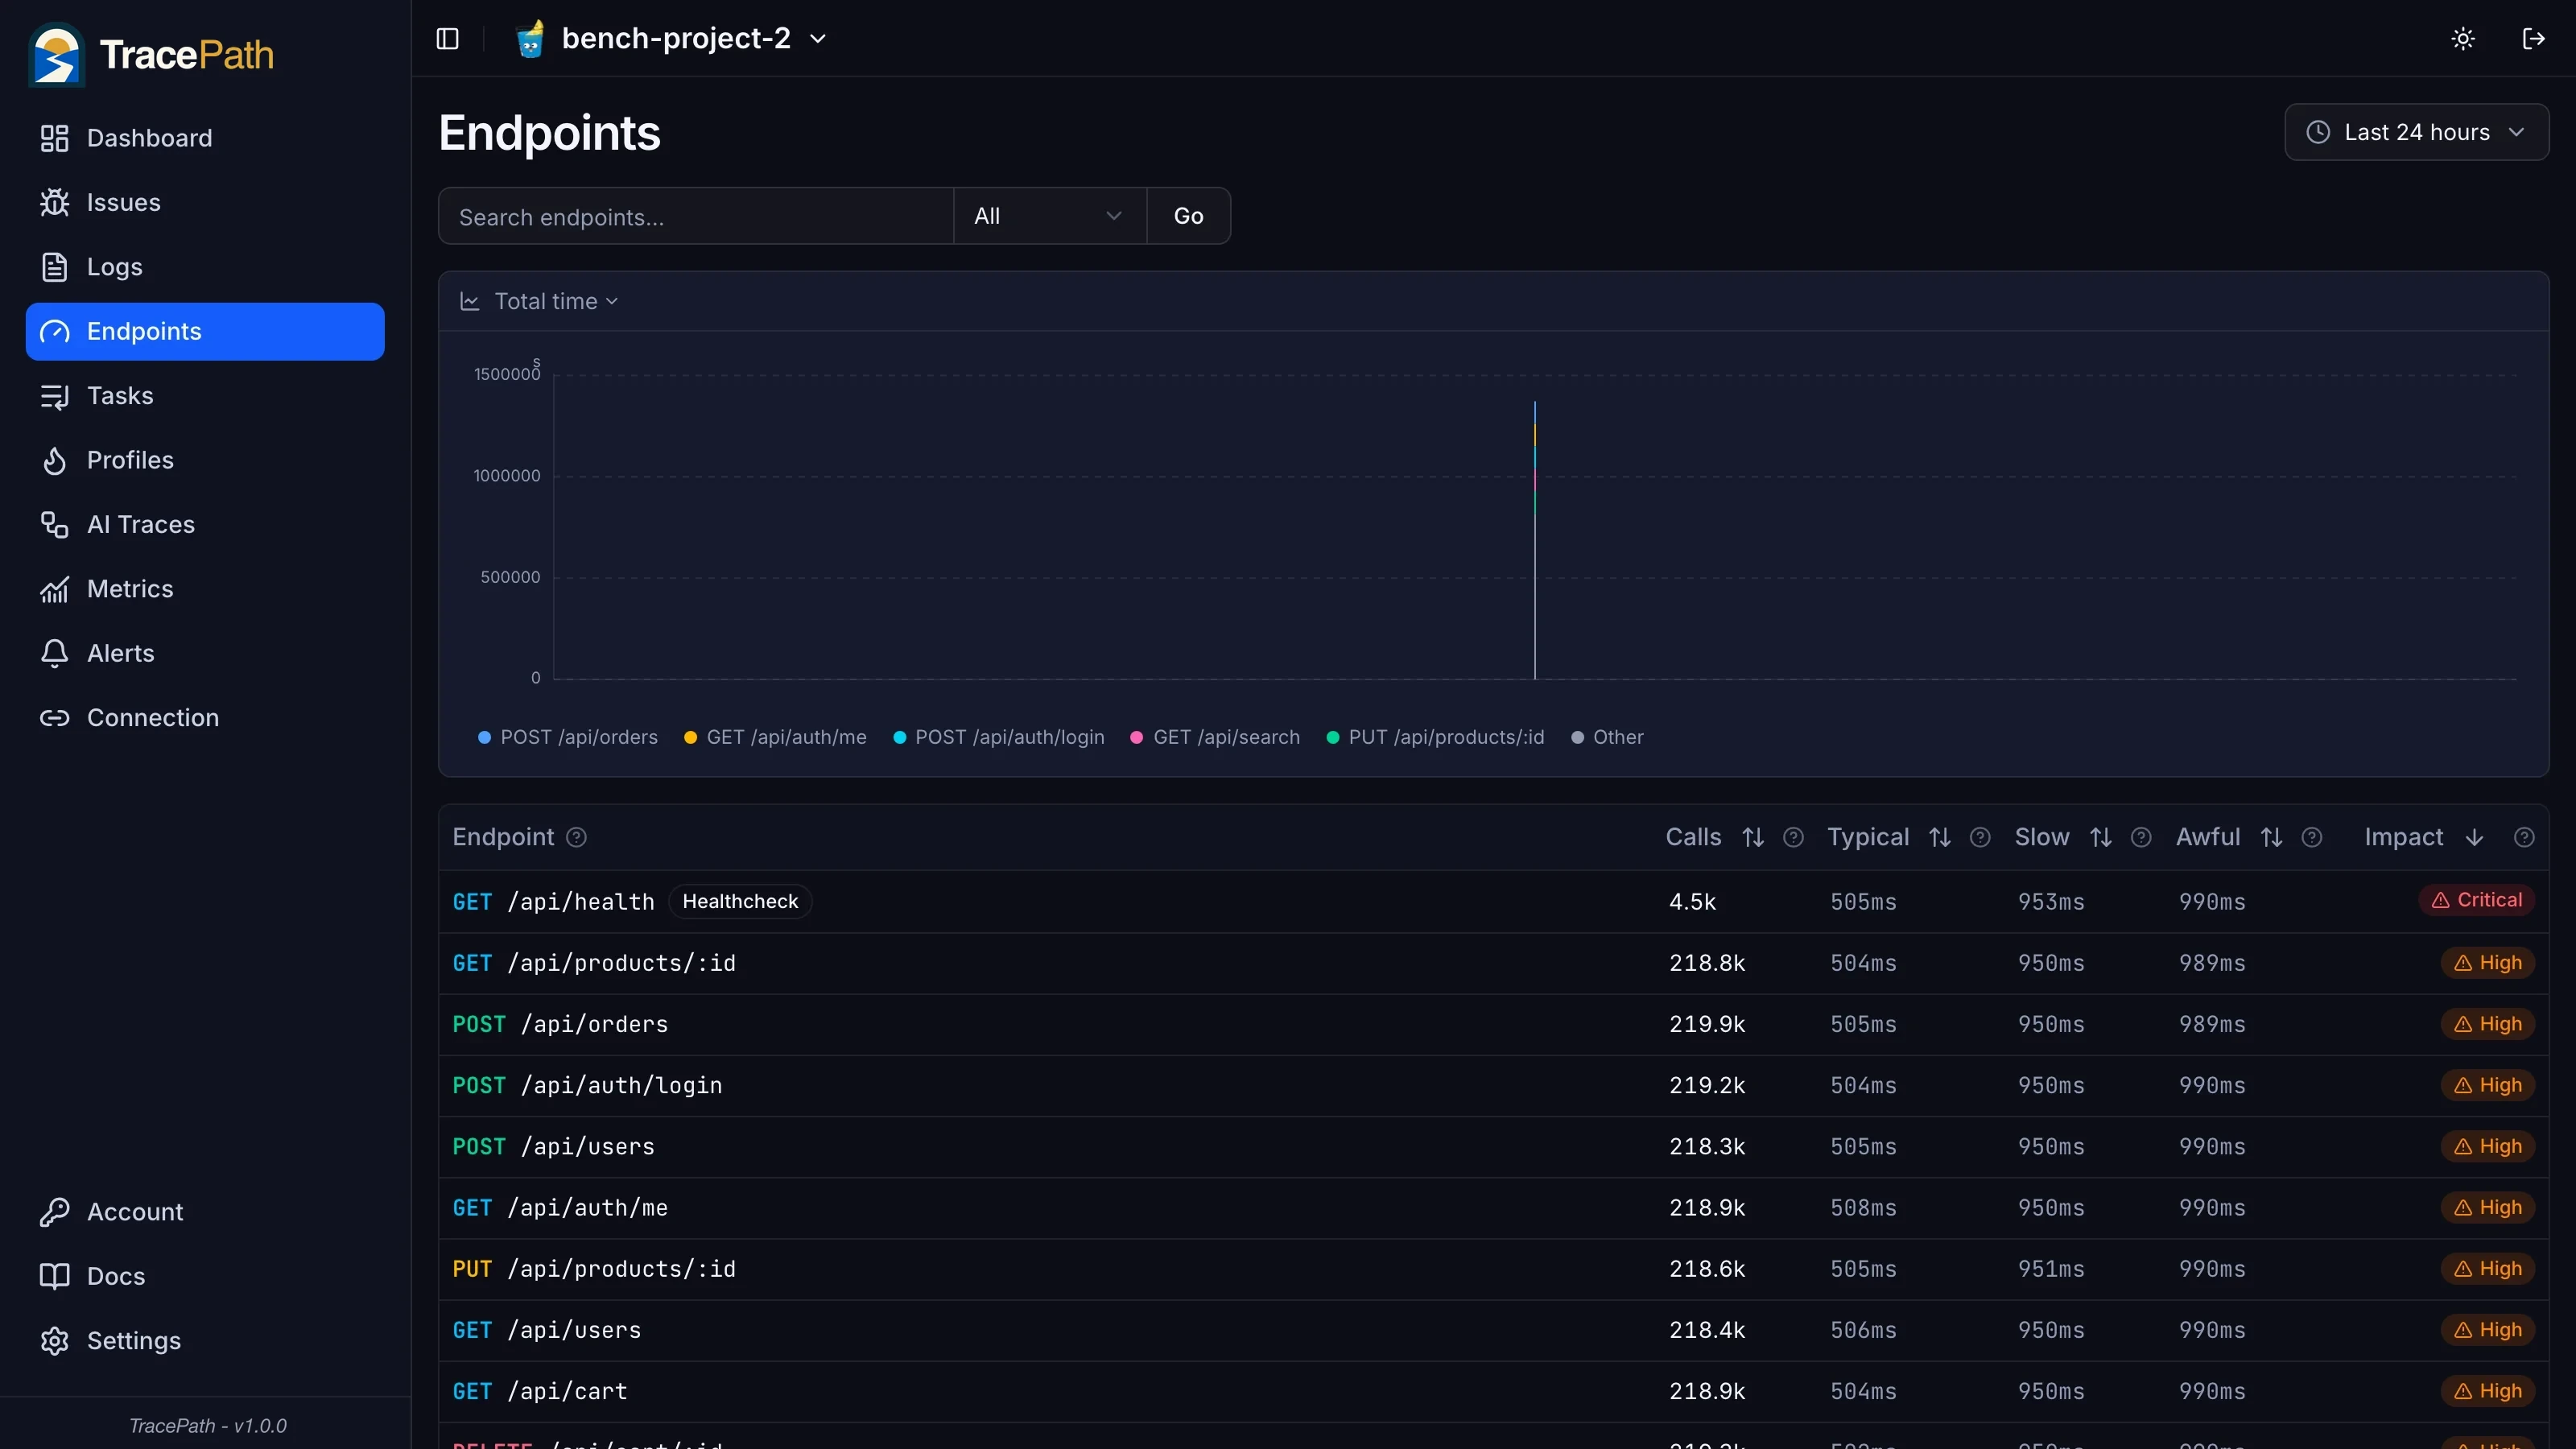
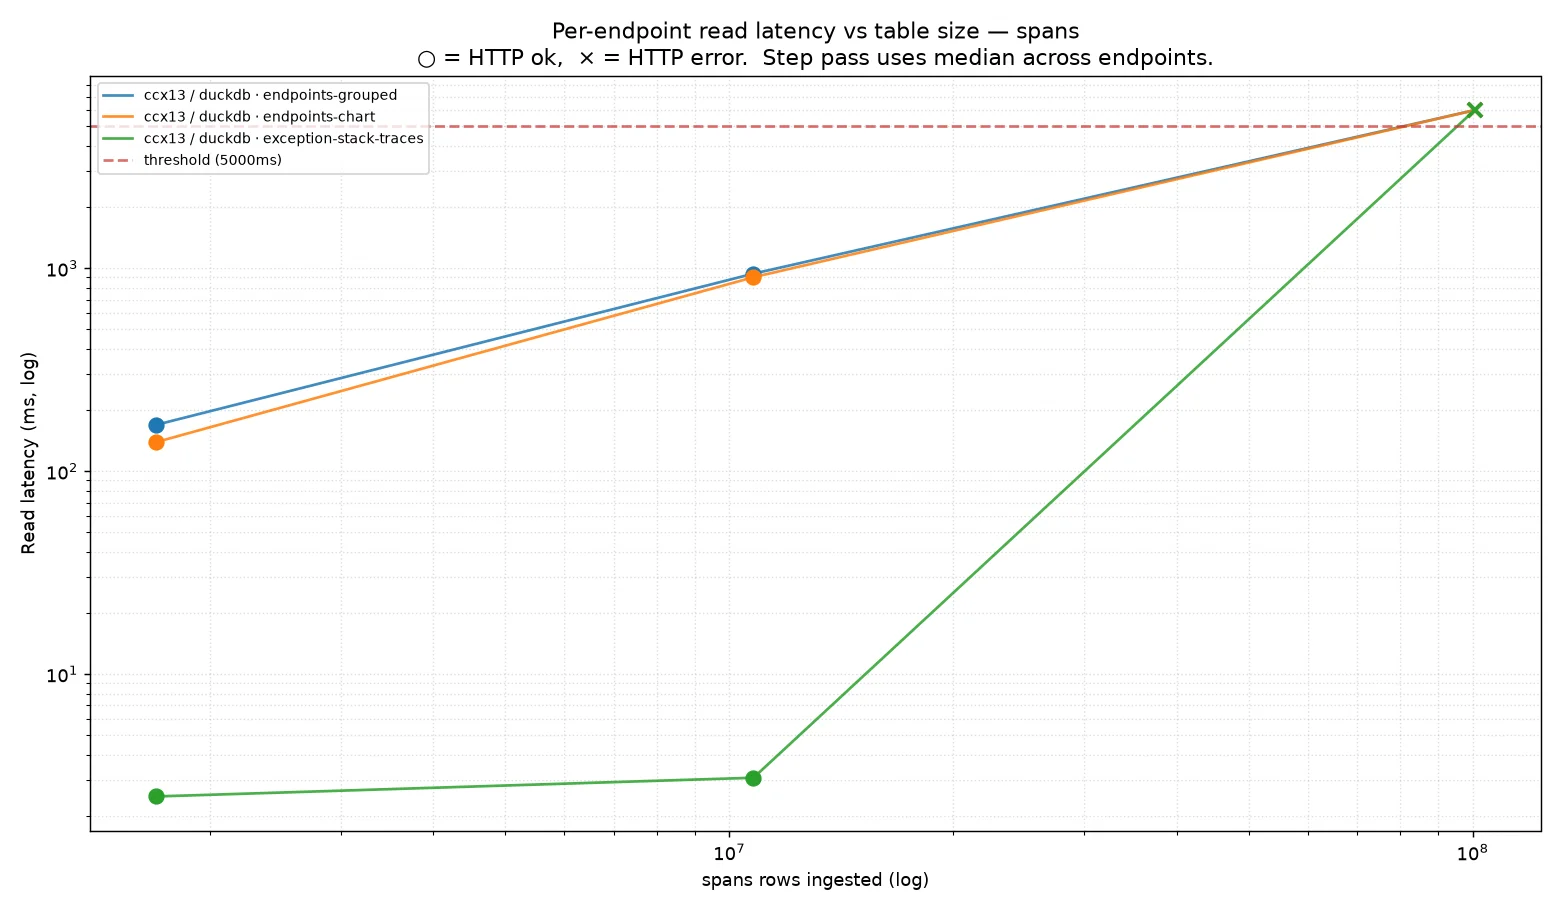
Every row in that table is a P50/P95/P99 aggregation over the spans behind it, and the stacked latency chart above it is a second aggregation. Those two queries cost 902 ms at 10M rows and blow past a full minute at 100M. On SQLite the same two pages died between 100k and 1M.
Logs were the numbers trusted least and checked hardest — an early bad run suggested for a full day that DuckDB could not read logs at all — and the truth turned out to be the earlier post's most interesting pattern repeated at ten times the rows. Here is the page in question:
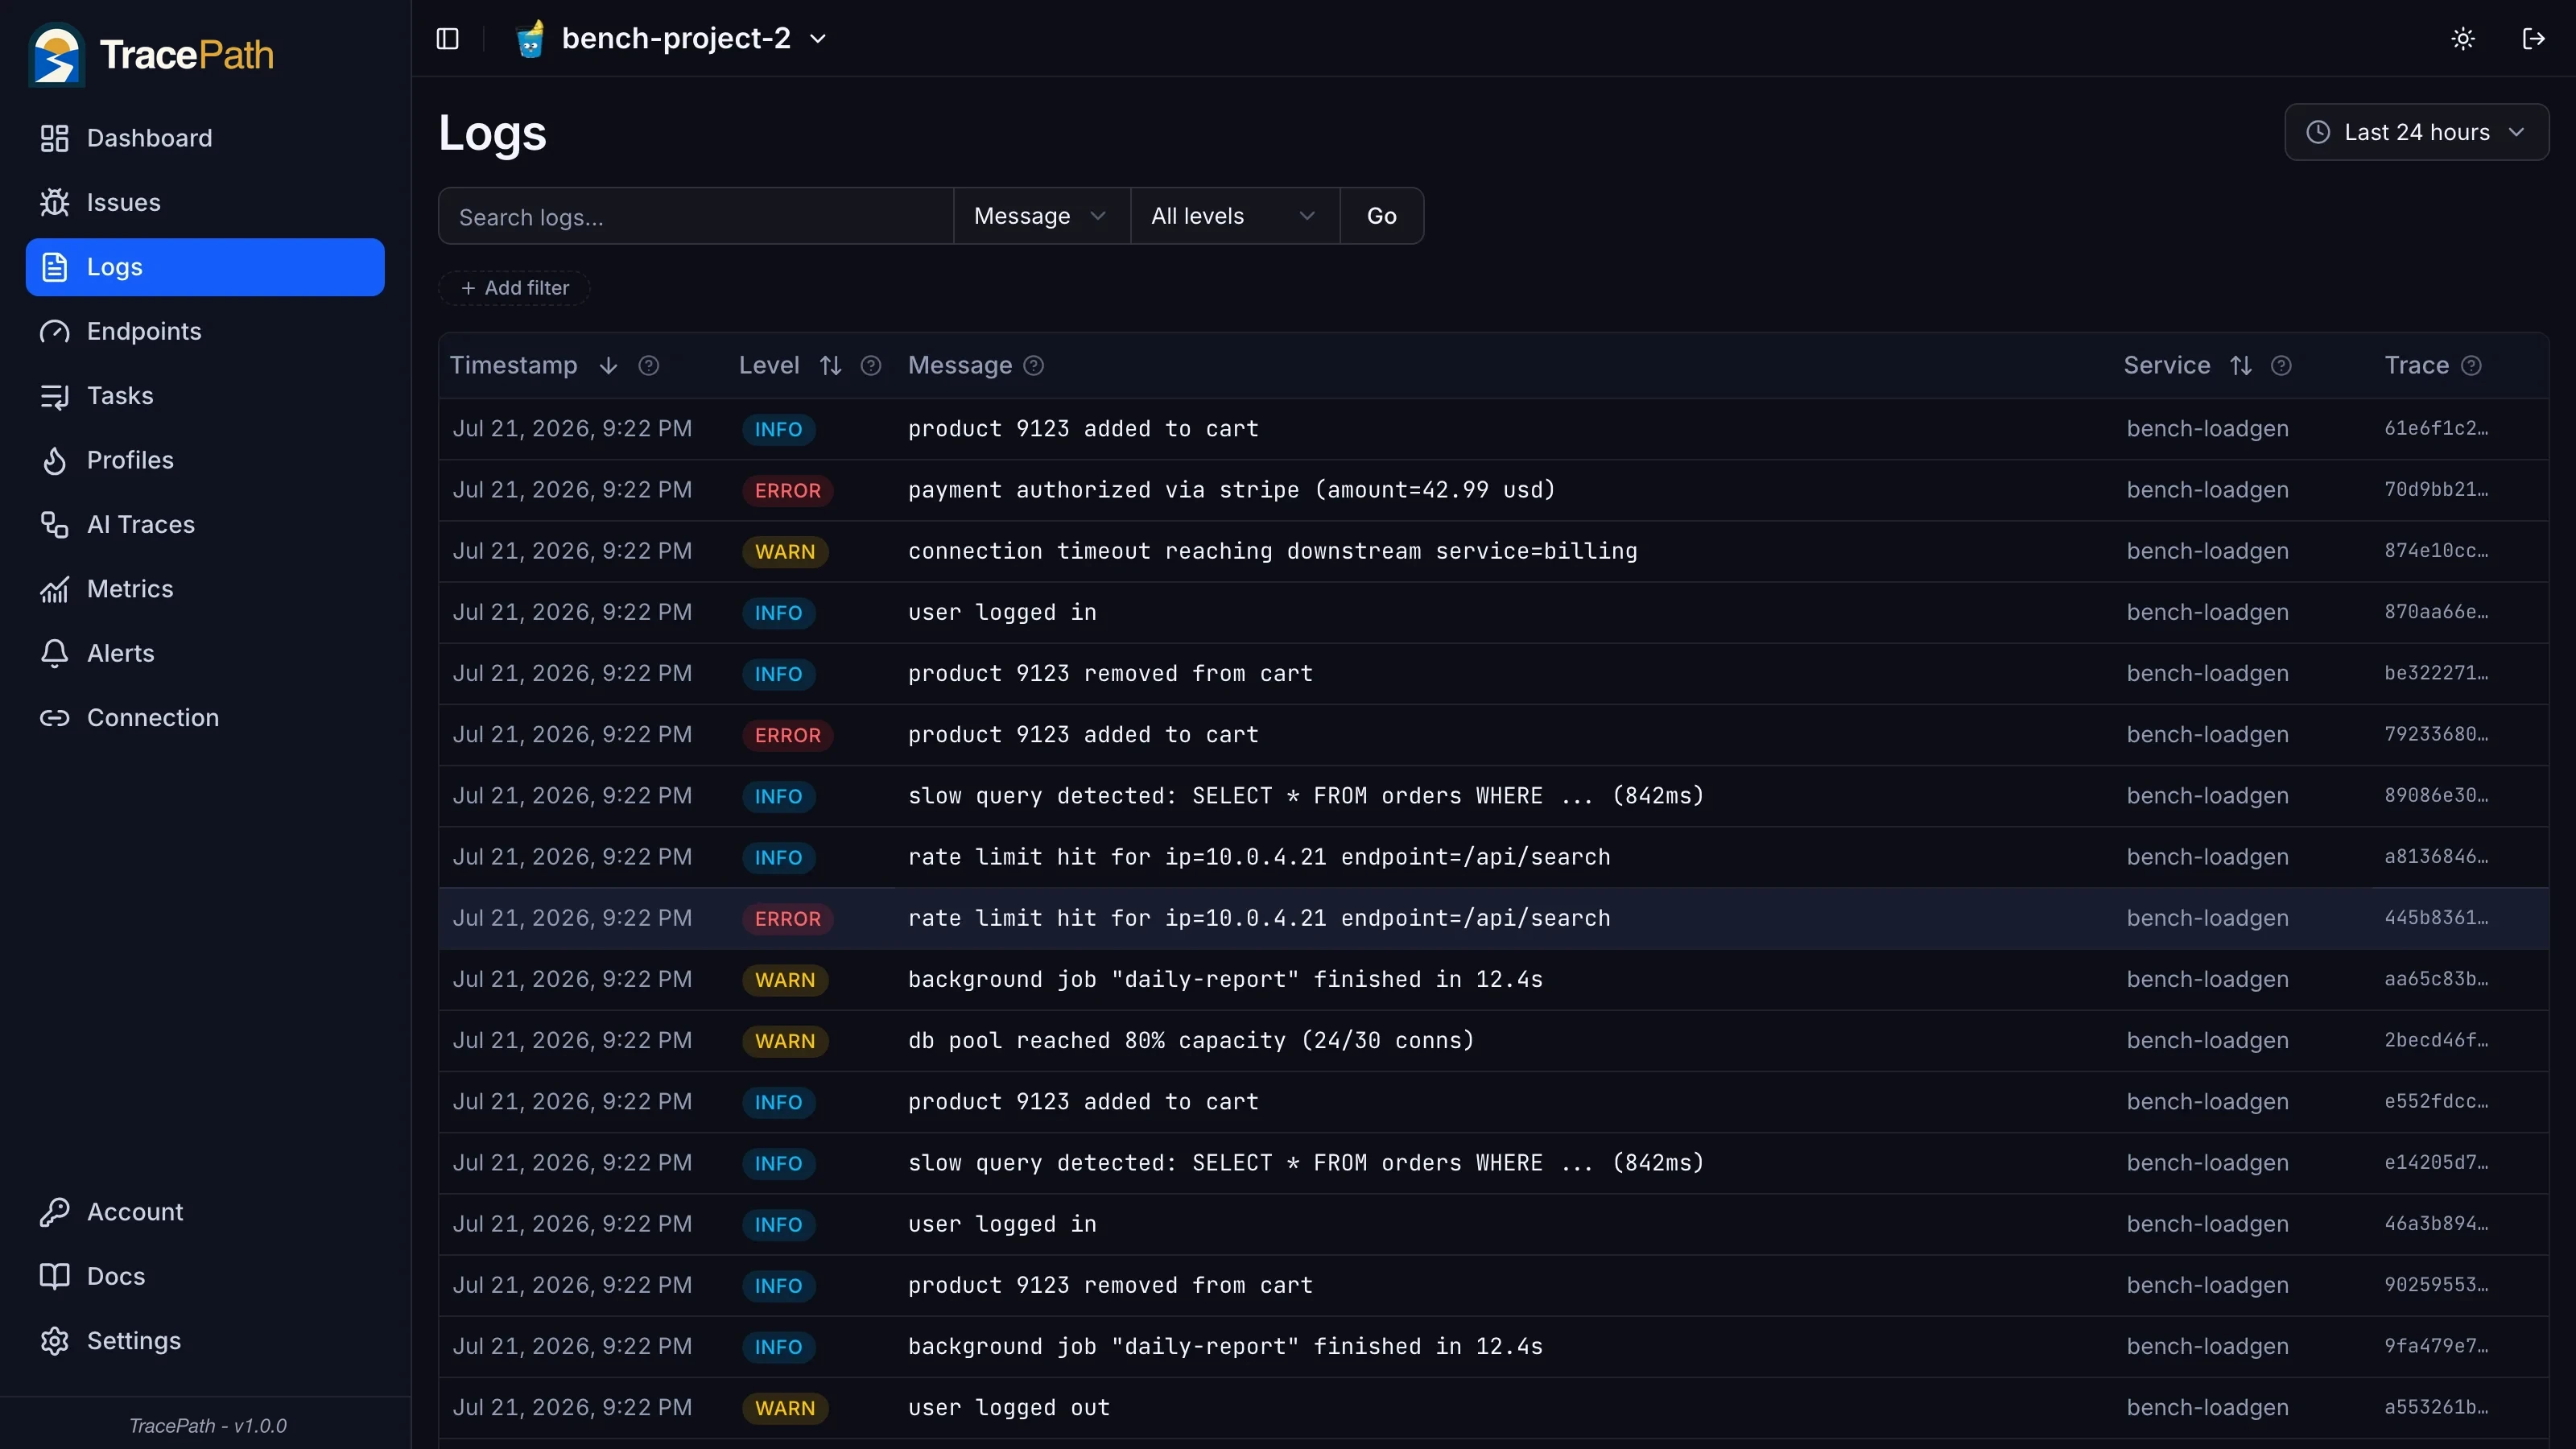
At their passing levels logs are the fastest dashboard of the three (85 ms median at 10M), and the failure at 100M is uneven in the same way SQLite's was at 1M. The trace-ID lookup still answers in 2 ms, the body search in 3.5 s, and only the severity filter — which matches and ranks a large slice of 100M rows — dies. The pages an on-call engineer actually opens mid-incident, find this trace and search this error, remain usable at 100M rows; the full-table scan does not. Retention policy should still follow that split. The split just moved 100x.
A billion rows on an 80 GB disk
The 1B level went on the ladder expecting to produce a paragraph about how it died, because every earlier attempt had ended the same way: container gone, level unreadable. This time the final fill step alone ran for 52 minutes, adding its last 900M points at a sustained 287k points/sec with the gate shedding the excess, and brought the table to 1,001,472,000 rows in 10.8 GB on disk — about 10.8 bytes per point after columnar compression, under an hour of total ingest across the ladder. The box stayed up, health checks answered the whole way through, and post-fill digestion took 5 seconds.
It is a big table you cannot look at. All three dashboard queries ran past 60 seconds at 1B, so the level fails, and 5B was never attempted since the ladder stops at the first failure. That was left deliberately: a 5B fill would prove the disk holds 54 GB of points, and nothing could read them. The practical summary of the ladder's top is that this box can store a billion metric points and can show you a hundred million of them.
How slow is slow, past the cliff
The previous post could only say "it timed out" about anything past a cliff. This time the entire ladder was rerun with a 60-second probe threshold to put real durations on the failing cells, and there were no durations to put. Every failing query was still running when the new cap cut it off. Metrics at 1B, still running at 61 s. Spans aggregations at 100M, still running at 61 s. The logs severity filter at 100M, still running at 61 s while the body search finished in 3.2 s beside it.
So the cliffs are not slopes on either database. Queries go from a second or three to more than a minute across a single 10x step in rows — the signature of an aggregation outgrowing its memory budget and spilling. The same absence showed up on SQLite at one hundredth the scale, and it is why this series publishes cliffs instead of curves: there is no slow-but-usable band above a cliff to plan around.
The 60-second run also caught a smaller flaw for the fix list: a cancelled dashboard query does not promptly release its read-pool connection, so after the two spans aggregations timed out, a 3 ms exceptions query queued behind them for 52 seconds. It affected no passing number, and it went on the same list the admission gate came from.
What a real fleet consumes
Cliffs are ceilings. What matters day to day is how far under them a real workload sits. The small-fleet shape from the earlier post — ten backends emitting 50 spans/sec, 200 log records/sec and 10 metric points/sec each — held against both builds:
| SQLite envelope used | DuckDB envelope used | |
|---|---|---|
| Spans (500/sec) | 1.7% | 0.5% |
| Logs (2,000/sec) | 40% | 2.7% |
| Metrics (100/sec) | 0.2% | 0.04% |
Writes were already a non-issue on SQLite for everything except logs, and on DuckDB they stop being a conversation. Retention is still the real knob, with new units. At this fleet's rates, logs reach their last passing read level (10M rows) in about 85 minutes and the failing level in about 14 hours; spans reach 10M in 5.5 hours; metrics reach 100M in 11 days. On SQLite the same measurement put the logs window at 50 seconds. An incident-sized working set — hours of spans and logs, days of metrics — fits on the right side of every DuckDB cliff with an ordinary retention job, which is the thing the SQLite build could not offer.
What was deliberately not measured
- Reads under concurrent writes. Fill, digest, settle, probe. Stricter isolation than the previous run, and still not what a dashboard experiences at 3 PM. Top of the future-work list.
- Mixed-signal load. Each signal had the box to itself; a real deployment writes all three at once and these ceilings do not simply add.
- Result correctness. Responses were timed, not diffed.
- Variance. Single-shot, as admitted above, with the median-of-three protocol still owed.
- Tuning. Stock configuration: a 4 GB DuckDB memory cap, a 256 MB checkpoint threshold, no schema or query changes. The 1B read failure looks like it wants a memory-budget experiment.
- ClickHouse. The client-server comparison is still owed, and it deserves its own run on these same ladders rather than a section squeezed in here.
- Durability over weeks. An hour-long billion-row fill says nothing about month three on the same disk — which is the subject of what degrades when telemetry lives in SQLite.
What was surprising
Reads were expected to win; that is what columnar storage is for. All three signals delivered 100x against a 10x expectation. But the finding that stuck was that the database was never the hard part. Every wrong-looking number over six days of benchmarking traced back to the ingest path in front of the engine, not the engine. DuckDB, whenever the code got out of its way, was boring in the best way a database can be boring.
The other surprise was logs, again. The earlier verdict was "keep logs off SQLite", and logs turned out to be the strongest single argument for the columnar engine: 15x on writes, 100x on the read cliff, with the incident-workflow pages still answering at 100M rows.
The verdict
The first post in this series claimed a $16 box could run an observability stack. The second tested the claim and returned it with an exception: not logs, and mind the read cliffs. This one retires the exception. On the same box, the DuckDB backend writes every signal faster than a small fleet emits, serves dashboards at row counts the SQLite backend cannot approach, and turns logs from the worst result in the dataset into the best. A billion metric points cost 10.8 GB of disk. The smallest improvement in the table is 3x.
Two engineering conclusions generalize past this codebase.
Pick the engine by the query, not by the write. All three cliffs were read cliffs. Write throughput is the number that is easy to benchmark and almost never the one that ends up binding.
Instrument the path in front of the database before blaming the database. These numbers exist because the benchmark first found a crash bug in the ingest path, and it was fixed before anything was rerun. Admission control is not an optimization; it is the difference between shedding load and being killed. The engine was never the problem.
TracePath Cloud does not run either embedded engine. The hosted platform runs the ClickHouse storage backend with PostgreSQL for relational state, which is the combination built for many tenants and long retention rather than for one machine — so none of the sizing above is yours to do. You point an OTLP exporter at the ingest host, and retention and ingest volume become a line on a plan:
OTEL_EXPORTER_OTLP_PROTOCOL=http/protobuf
OTEL_EXPORTER_OTLP_ENDPOINT=https://ingest.tracepath.dev/api/otel
OTEL_EXPORTER_OTLP_HEADERS=Authorization=Bearer <project_token>
The dashboards these probes hammered are the shipped ones: traces and endpoint latency, logs, metrics. Setup for every language and for the OpenTelemetry Collector is in the docs.
FAQ
Why is a columnar database so much better at dashboard queries?
Because dashboard queries read a few columns from many rows. A row store has to walk every row in range to reach the two columns a percentile needs; a column store reads only those columns, compressed, in blocks. That difference does not show up at ten thousand rows and dominates at a hundred million.
Does DuckDB write faster than SQLite in general?
Not universally — it won here, on bulk appends of telemetry-shaped rows, using DuckDB's append API rather than row-by-row inserts. For small transactional writes with frequent updates, which is what the relational side of this backend does, SQLite remains the right engine, and that is exactly how the two databases are split in the codebase.
What is a "read cliff"?
The largest table size at which real dashboard pages still load within the threshold: a median of three endpoint probes at or under 5 seconds with nothing timing out. The term is chosen because one 10x step past it, queries do not degrade — they stop returning.
Are these numbers reproducible?
They are single-shot runs, disclosed as such. The key cells reproduced across several debugging runs on different days, but a median-of-three protocol is still owed. Treat the orders of magnitude as solid and the third digit as not.
Which database does TracePath Cloud use?
ClickHouse for telemetry and PostgreSQL for relational state. The embedded engines exist because the backend supports several storage layers, which is what makes a like-for-like comparison like this possible at all.
Questions, or a number you think is wrong: [email protected].