System Design: Building a world-class symbolicator
 Dusan StanojevicJune 20, 2026
The shape of your data can make a service fast or slow. A walk from the slow version to the fast one, built on a real example: turning unreadable production crashes back into readable code.
Premature optimization is the root of all evil.
Knuth wrote that in 1974, and it's still true today. Quality software is built by understanding the problem first, then improving the solution pragmatically, one measured step at a time. That's the structure of this post.
When you ship JavaScript to production, a build step shrinks it into one file, the bundle. A function named validateCheckout becomes n, whitespace vanishes, and the whole program collapses onto a single line. This is minification. Great for download size, miserable the moment something breaks.
Because when that code crashes, the report you get is a stack trace: the chain of function calls that led to the crash. Each call is a frame, printed as a line like at n (app.min.js:1:5114). A spot in a file nobody can read, under a name that used to mean something. Stack a dozen of those and you can't act on it.
Turning that gibberish back into validateCheckout (checkout.js:48:10) has a name: symbolication. The service that does it is a symbolicator. You feed it the minified stack trace plus a build artifact or two, chiefly the source map: the companion file your build tool emits that records where each scrap of minified code came from. It hands you back real files, real line numbers, real function names. Every serious error tracker has one.
I've taken apart the algorithm inside a symbolicator before, by hand, twice: once for JavaScript source maps and once for an obfuscated Flutter crash. You don't need either to follow this. This post is about the part both skipped. It's the part that decides whether the thing works in production: the system design.
The job sounds simple. Run that algorithm for every crash, from every release, of every customer. Do it fast enough that symbolication never makes an event show up late. The simple version is painfully slow. The road from slow to fast runs through caching, binary file layout, and the operating system's memory manager. None of that is specific to crashes. A symbolicator is just a sharp example of a common shape: data that's expensive to build and cheap to look up. Parse once, cache the right shape, let the kernel do the rest.
The problem
Strip everything away and a symbolicator is one function:
Symbolicate(file, line, col) -> (origFile, origLine, origCol, fnName)Calling it once is cheap. But exceptions are rarely a one-off; they come in bursts. You push a bug and suddenly you're getting spammed with the same crash, and the larger your app, the more of them come in. Client-side code is the worst case: a million browsers can hit the same crash in the same minute. Each error carries a dozen frames, spread across whatever bundles and releases those users happened to be running. So the real question isn't "how do I symbolicate a frame." I answered that already. It's "what sits behind Symbolicate so the ten-thousandth call in a sudden spike is as cheap as the first."
Let me build that up the way I actually built it.
Stage 1: the dumb version that parses on every request
A request arrives carrying a stack frame: a file, a line, a column. To turn it back into source you need the build's debug artifact, and which one depends on the platform. JavaScript ships a source map plus the bundle. iOS ships a .dSYM. Dart ships a .symbols file. Different formats, one job: each maps a compiled position back to the original file, line, and name.
The simplest possible service does the whole thing inline, fresh on every request:
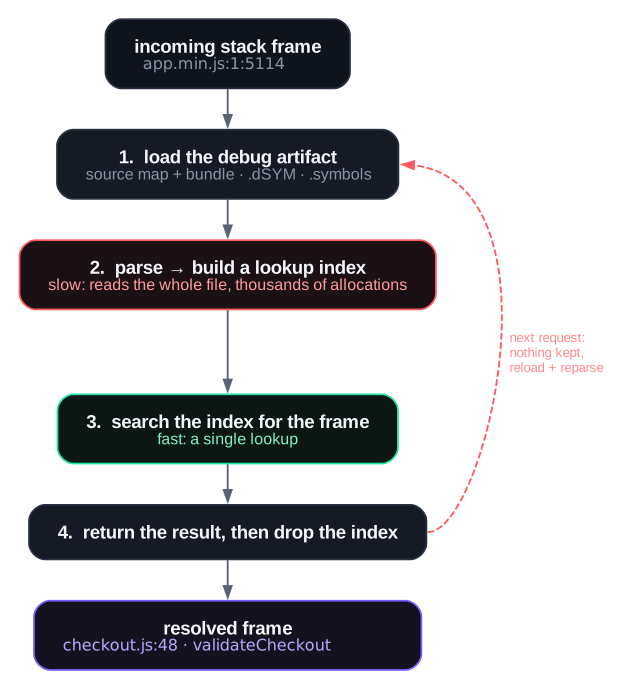
Step 2 is where the cost is. Parsing the artifact walks the whole file and builds a sizable in-memory index: milliseconds of work, thousands of allocations. The lookup in step 3 is a plain search by comparison, effectively free.
Here's the waste. A release's debug artifact is frozen the moment you ship it; it never changes. Yet this version rebuilds the same index from the same bytes on every request, then throws it away. During a burst, a thousand frames a second off one broken release, you run that identical parse a thousand times a second and spend almost nothing on the lookups you actually came for.
So the fix names itself. Parse once per artifact, look up once per frame. That's the easy part. Making it hold up in production is the rest of the work.
Stage 2: build the structure once, keep it in memory
Just how lopsided is that split? Here it is in TracePath, where the parse-and-resolve step is BuildTW and the per-frame lookup is LookupTW. A local go test -bench on a real pair, preact.module.js (10 KB) and its 69 KB source map:
BenchmarkBuildTW    975232 ns/op    771942 B/op    10260 allocs/op
BenchmarkLookupTW       44.24 ns/op      24 B/op        2 allocs/op
The lookup is 44 nanoseconds. The parse in front of it is 975 microseconds, three quarters of a megabyte of garbage, ten thousand allocations. The build is ~22,000× more expensive than the lookup it enables. So you cache the parse and never repeat it. The interesting question is what to cache, and the whole post hinges on the answer.
The lazy answer is to keep the live parsed object: a Go struct full of slices and a map[string]int32 name index. It works, but it's a sprawling object graph: thousands of little allocations, every one a pointer the garbage collector (GC) chases on every cycle, for a value that's immutable and that you'd like to keep around for hours. Cache ten thousand of those and you've turned a symbolicator into a GC benchmark.
So BuildTW doesn't return an object graph. It serializes to bytes, in TracePath's .tw resolver format: the compact, little-endian layout the engine compiles every build artifact into and runs on in production. A .tw is a cache artifact, never the source of truth, so it can afford to be dumb. A header, a sorted array of fixed-size token records (one per mapped position), then two interned string tables for file and function names:
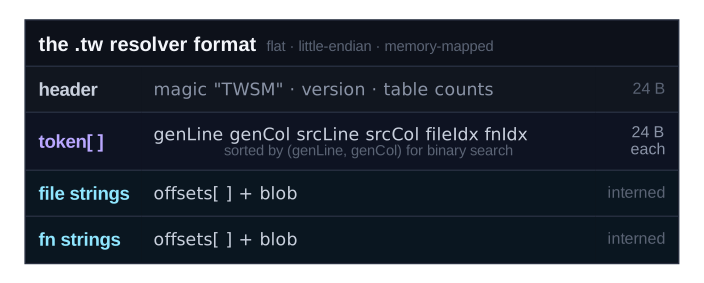
Every token is a fixed 24 bytes, six little-endian uint32s: the generated line and column (where it sits in the minified bundle), the original line and column (where it came from in your source), and two indices into the string tables (the source file and the function name). No pointers anywhere. A string is an index, and the tables turn an index into bytes. Here's the heart of the serializer:
out = append(out, twMagic[:]...)                              // "TWSM"
out = binary.LittleEndian.AppendUint32(out, twVersion)
out = binary.LittleEndian.AppendUint32(out, uint32(len(b.tokens)))
// ... file + fn counts + a reserved word ...

for i := range b.tokens {
	t := &b.tokens[i]
	out = binary.LittleEndian.AppendUint32(out, t.genLine)
	out = binary.LittleEndian.AppendUint32(out, t.genCol)
	out = binary.LittleEndian.AppendUint32(out, t.srcLine)
	out = binary.LittleEndian.AppendUint32(out, t.srcCol)
	out = binary.LittleEndian.AppendUint32(out, uint32(t.fileIdx))
	out = binary.LittleEndian.AppendUint32(out, uint32(t.fnIdx))
}
The tokens are sorted by generated position. That's the whole point. A lookup becomes a binary search over a slice of fixed-size records, no decoding involved. LookupTW is just sort.Search plus a couple of field reads:
idx := sort.Search(l.tokenCount, func(i int) bool {
	gl, gc := tokAt(i)                            // read token i's generated pos
	return gl > genLine || (gl == genLine && gc > genCol)
})
// idx-1 is the floor token: the greatest position <= the frame.
// read its srcLine/srcCol/fileIdx/fnIdx straight out of the bytes,
// resolve the two indices through the string tables, done.
That's the 44-nanosecond number. The two allocations it reports are the two strings it copies out at the end, the file name and the function name. Everything else is read in place. No parse, no garbage.
On the preact pair, BuildTW turns a 69 KB map and a 10 KB bundle into a 48 KB .tw blob with about 2,000 tokens. That blob is one allocation the GC never looks inside. It's the unit we cache. The cache is a plain LRU keyed by file name, bounded by entry count and total bytes. (LRU means least-recently-used: when it fills up, whatever nobody has touched in the longest gets dropped.)
func (s *twcachemem) get(name string) ([]byte, func(), bool) {
	s.mu.Lock()
	defer s.mu.Unlock()
	el, ok := s.items[name]
	if !ok {
		return nil, noop, false
	}
	s.order.MoveToFront(el)               // mark most-recently-used
	return el.Value.(*memEntry).data, noop, true
}
The cache wrapper builds each file exactly once, even under a stampede: the first request for a file builds it while any concurrent requests for that file wait on the same in-flight load, instead of all calling BuildTW at once. The per-request path becomes:
data, done, err := cache.Get(ctx, fileKey, func(ctx context.Context) ([]byte, error) {
	return sourcemap.BuildTW(mapBytes, bundleBytes)   // runs once per file
})
defer done()
frame, ok := sourcemap.LookupTW(data, line, col)      // 44 ns, every frame after the first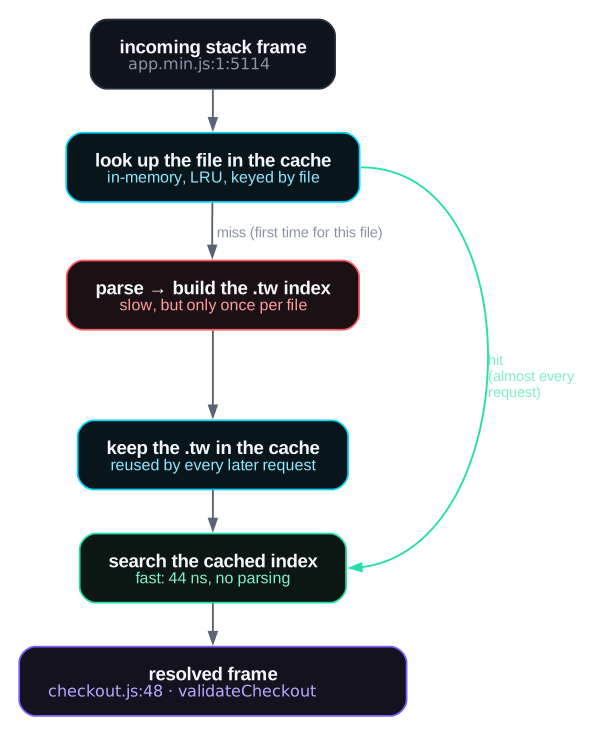
Now the first frame from a bundle pays the 975 µs. Every frame after it pays 44 ns, for the rest of that bundle's life in cache. At a thousand errors a second over a working set that fits in memory, we just deleted nearly all the CPU.
Why serialize to bytes instead of caching the parsed struct? Three reasons, and the third is the one that matters:
- It's compact. 48 KB beats a sprawl of thousands of small objects.
- It's invisible to the GC. One
[]bytewith no inner pointers. The collector skips straight over it, however many thousands we hold. - It's already the exact shape you'd write to a file. A flat, pointer-free, offset-addressed byte array is already a file format. That's the entire next stage.
Hold that third point. But first, the catch that ends Stage 2: this cache lives entirely in RAM.
To keep every lookup fast, every .tw you might need has to be resident at once. The whole working set has to fit in memory. For one small app it does, a handful of bundles. A platform symbolicating at scale is the opposite. A mobile app has a long tail of versions still installed on real devices. A website ships a new bundle on every deploy, and crashes keep arriving from every release a user is still running. That's thousands of distinct artifacts, each with its own .tw, and the old ones never fully go quiet. Hold them all in memory, on every replica, and you're paying a bill you can't afford. The LRU's only answer is to evict, which just turns the overflow back into 975 µs rebuilds.
Two smaller cracks sit next to it. A restart is a cold start: the cache is gone, and the first wave of every bundle re-parses from scratch. Replicas don't share: ten servers behind a load balancer keep ten separate caches, each re-parsing the same bundle the first time a frame lands there.
Three problems, one root. The structure lives on one heap, in one process, for only as long as that process runs. The next stage moves it off the heap entirely, and fixes all three at once.
Stage 3: store it and mmap it
Reread reason 3 above. The thing we cache is a flat []byte with no pointers; every "reference" is just an integer offset from the start of the buffer. A structure like that doesn't care whether its bytes live in a heap allocation or in a file on disk. The bytes are the structure.
So persisting it is os.WriteFile. And loading it is mmap, the system call that maps a file straight into your process's memory. You get back a byte array that is the file on disk. The OS pulls in each chunk the first time you touch it, a page fault, instead of copying the whole thing up front:
func mmapFile(path string) ([]byte, func(), error) {
	f, err := os.Open(path)
	if err != nil {
		return nil, nil, err
	}
	defer f.Close()

	st, _ := f.Stat()
	size := st.Size()

	data, err := syscall.Mmap(int(f.Fd()), 0, int(size),
		syscall.PROT_READ, syscall.MAP_SHARED)
	if err != nil {
		return nil, nil, err
	}
	return data, func() { _ = syscall.Munmap(data) }, nil
}
Now look at the signature we've been calling all along:
func LookupTW(data []byte, genLine, genCol uint32) (StackTraceFrame, bool)It takes a []byte. It never cared where the bytes came from. A heap buffer from make, a memory-mapped file from syscall.Mmap: to LookupTW they're the same thing. We designed the structure so they could be. Stage 2 and Stage 3 run the identical lookup code over identical bytes. The only thing that changed is who owns the pages.
And that's what the binary search buys us: we search the file in place. No read, no decode, no copy into a struct. The search over ~2,000 tokens touches about eleven 24-byte records. On a 48 KB file those land in a few pages. So the first lookup costs a few page faults, and every one after it is a plain memory read at RAM speed. The disk store wires mmapFile straight into the cache's get:
func (s *twcachedisk) get(name string) ([]byte, func(), bool) {
	path, err := s.path(name)
	if err != nil {
		return nil, noop, false
	}
	data, unmap, err := mmapFile(path)   // []byte backed by the file
	if err != nil {
		return nil, noop, false
	}
	s.noteUse(name, int64(len(data)))
	return data, unmap, true             // caller calls unmap when done
}
That done/unmap is the one bit of discipline mmap adds. The []byte is only valid until you unmap it, so the request borrows it, does its lookups, and releases it at the end. It's safe because LookupTW copies out the two strings it returns: the file name and function name become real Go strings on the heap, so the resolved frame outlives the mapping even though everything else was read straight from the file's pages.
Here's what quietly falls out of this, the payoff for all three of Stage 2's leftover problems:
- The OS page cache becomes the cache tier, for free. The page cache is just the RAM the OS already uses to hold recently-read file data. Hot
.twfiles stay resident there, because the kernel keeps touched pages around. Cold ones get dropped under memory pressure by the kernel's own reclaim. I handed the eviction problem to the operating system, which has tuned that exact algorithm for fifty years. - It survives restarts. The
.twfiles are on disk. A restart re-mmaps them in microseconds. No re-parse, no cold-start stampede. - Replicas share. Put the prebuilt
.twblobs in shared object storage. Every replica pulls the same 48 KB artifact instead of re-deriving it from 79 KB of map-plus-bundle. A fresh server is warm almost immediately.
In production these stack into one cascade, cheapest first:
- Local mmap cache. The
.twfile is on this box. Map it, search it, done in microseconds. - Object storage. Not local yet. Download the prebuilt 48 KB
.tw, write it down, map it. Still no parse. - Rebuild. No
.twexists anywhere. This is the first crash of a brand-new release. Run the full 975 µsBuildTWonce, then write the result to storage so steps 1 and 2 cover every replica after that.
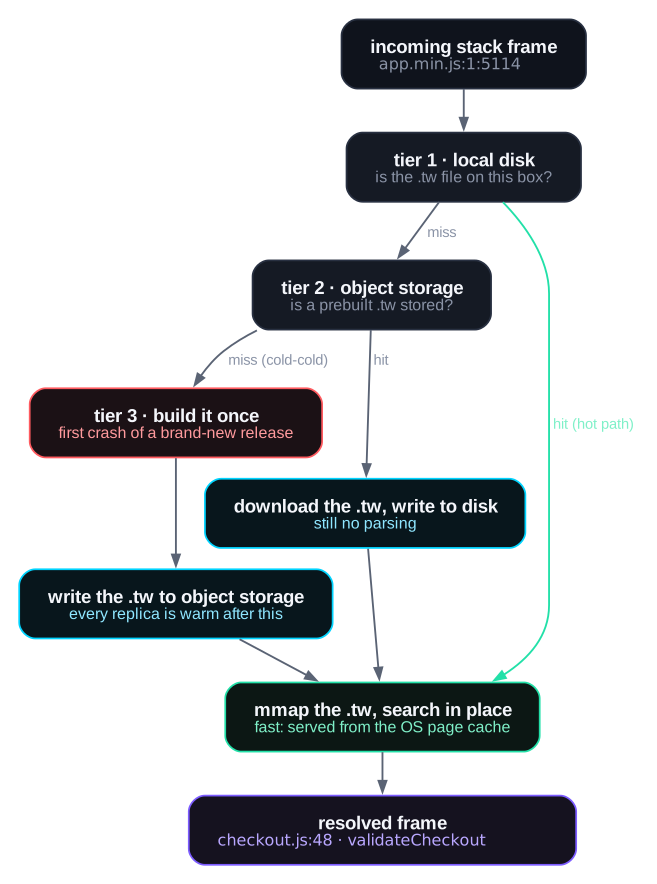
The expensive path, Stage 1's full parse, is now the rare cold-cold case. It runs once per release, ever, instead of once per frame.
The shape of the win
The same LookupTW, fed from four different places:
| Stage | Per-frame cost | Survives restart | Shared across replicas | GC pressure |
|---|---|---|---|---|
| 1 · parse every request | ~975 µs | no | no | 10k allocs/frame |
2 · in-memory .tw cache | ~44 ns (after first) | no | no | one []byte, no scan |
| 3 · disk + mmap | ~44 ns + a few page faults cold | yes | yes (via storage) | none (pages aren't heap) |
What carried the whole thing was a data-layout choice from Stage 2, not a clever caching layer. We made the searchable structure a flat, pointer-free []byte instead of a Go object graph. That one choice collapsed two problems into one: caching it in memory and storing it on disk became the same bytes handed to the same function. And the kernel's page cache, which I didn't write and don't tune, does my eviction.
Does it survive contact with production?
A 44-nanosecond lookup is a nice number on a bench. The real question is what happens under a firehose: thousands of stack traces a second, hundreds of releases, a working set bigger than RAM. So I ran the repo's standard processor benchmark against the best baseline I could find.
The baseline is Honeycomb's open-source OpenTelemetry symbolicator processors, the sourcemapprocessor for JavaScript and the dsymprocessor for iOS. Under the hood they wrap Sentry's symbolic, the Rust library that powers Sentry's own symbolication. It's the engine plenty of production error tracking already runs on, and it's mature, well-optimized Rust. The only way a Go service beats that is by doing less work, not faster work, and that's the whole design: on the hot path, skip the parse entirely.
To compare the two symbolicators and nothing else, I run both as OpenTelemetry Collector processors, the plugin slot that rewrites telemetry as it passes through. Honeycomb's are the sourcemapprocessor and dsymprocessor; TracePath's is its own. Both sit in the same collector, behind the same Go load generator firing crash reports over OTLP, in front of the same small Rust receiver that checks every frame came back resolved, on the same Hetzner box (a ccx33: 8 vCPU, 32 GB). Swap the processor, change nothing else. Load ramps from 8 to 256 connections, and I keep the peak.
Memory needs one caveat, because it's where the gap is widest. RAM is sampled from outside the process, since Go's own heap stats can't see Honeycomb's parsed maps (they live on the C heap inside Sentry's symbolic) and would over-count TracePath's mmap'd pages (the kernel reclaims those on demand). The corpus is a real minified bundle padded to a production-realistic size, so a cache miss costs what it would in production. Then three scenarios, each pointed at a different failure mode:
- hot: one bundle, always cache-warm. The ceiling: pure lookup throughput with zero misses.
- churn: 512 bundles cycling through a 128-entry cache, so almost every request misses. This is the real world, where traffic spans every release you've ever shipped, and it's where the cost of a miss gets exposed.
- oom: thousands of fat bundles on a small 2-vCPU, 8 GB box, a working set far bigger than RAM. The survival test: who stays up, and who the kernel kills. (The padding grows TracePath's token table too, so nothing's tilted in its favor.)
Four columns carry the story. max stacks/s is throughput, stack traces resolved per second. p99 ms is tail latency, the slowest 1% of requests, the part users feel. peak RSS MB is the most RAM the process ever held. symb% is the correctness check, the fraction of frames that came back resolved. outcome is whether the process lived or got killed.
Here's JavaScript, TracePath against Honeycomb:
| impl | scenario | max stacks/s | p99 ms | peak RSS MB | symb% | outcome |
|---|---|---|---|---|---|---|
| honeycomb | hot | 20,735 | 373 | 125 | 100 | survived |
| honeycomb | churn | 938 | 2,962 | 4,491 | 100 | survived |
| honeycomb | oom | 938 | 2,962 | 6,844 | 99 | survived |
| tracepath-oxc-disk | hot | 30,910 | 4.1 | 379 | 100 | survived |
| tracepath-oxc-disk | churn | 29,923 | 17.7 | 361 | 100 | survived |
| tracepath-oxc-disk | oom | 29,923 | 17.7 | 6,851 | 100 | survived |
Correctness is a tie. Everything resolves ~100% of frames. That's the price of admission, not a differentiator. The differentiator is everything else:
- Churn throughput: 938 → 29,923 stacks/s, about 32×. This is the whole post in one number. On every cache miss Honeycomb re-parses the raw source map through
symbolic, the Stage 1 "dumb version" tax paid forever, and it pins about one core: its average CPU sat near 104%, roughly a single core busy, while TracePath spread across seven cores at ~690%. TracePath on a miss just re-opens a precompiled.twfile and maps it. The 32× is the distance between "re-derive the structure" and "the structure is already the file." - Latency: hot p99 373 ms → 4.1 ms (~90×), churn p99 2,962 ms → 17.7 ms (~168×). When the cache is warm both are quick-ish per core. But at saturation Honeycomb's tail blows out to multiple seconds. A symbolicator with a 3-second p99 is why your errors show up late.
- Memory under churn: 4,491 MB → 361 MB, about 12× less. Honeycomb keeps the raw map JSON and the minified bundle resident per cache entry. TracePath throws both away the instant it has compiled the compact
.tw. (Both hit ~6.8 GB peak in the oom run, but read that with the asterisk above. TracePath's are reclaimable page-cache pages, and it sustains 30k/s there where Honeycomb manages 938. Survival is the next section.)
The mode I run in production: oxc + disk
Those TracePath rows were one configuration. The benchmark swept four, two parsers crossed with two cache tiers. The full matrix tells you which knobs to turn:
| impl | scenario | max stacks/s | p99 ms | peak RSS MB | outcome |
|---|---|---|---|---|---|
| tracepath-oxc-disk | churn | 29,923 | 17.7 | 361 | survived |
| tracepath-oxc-disk | oom | 29,923 | 17.7 | 6,851 | survived |
| tracepath-oxc-mem | churn | 16,755 | 128.8 | 584 | survived |
| tracepath-oxc-mem | oom | 16,755 | 128.8 | 7,469 | died@40s |
| tracepath-goja-disk | churn | 29,804 | 22.7 | 337 | survived |
| tracepath-goja-mem | churn | 3,414 | 6,342 | 1,309 | survived |
| tracepath-goja-mem | oom | 3,414 | 6,342 | 7,456 | died@236s |
Two independent decisions fall out, and the data picks both.
Disk over memory, because memory dies. This is the Stage 2 → Stage 3 jump, now with a body count. Both -mem variants get OOM-killed on the 8 GB box (oxc-mem at 40 seconds, goja-mem at 236). The in-memory cache holds every .tw on the Go heap. The heap can't be reclaimed under pressure, so the kernel kills the process. Both -disk variants survive the same workload. An mmap'd .tw is just file pages the kernel can drop and re-fault on demand. That's eviction I don't write and can't get wrong. Disk also keeps churn memory flat, 361 MB against goja-mem's 1,309 MB, because the working set lives in the page cache, not the heap.
oxc over goja, because the parser is the miss cost. The bundle parser only runs on a cache miss (the BuildTW parse). So it's invisible in hot and decisive in churn. goja is a pure-Go JavaScript parser: zero dependencies, always available, and what the stock build ships. oxc is a Rust parser, the one rspack and friends use, linked in over cgo (Go calling a native library). On the churn run oxc-disk holds a 17.7 ms p99 against goja-disk's 22.7 ms, and the gap widens the harder you lean on misses. Pay the build complexity and the cold path gets cheaper.
Put them together. oxc + disk has the best latency, and it's the only corner that stays flat on memory and survives the OOM box. That's what I run. It's opt-in, though. The stock image ships goja + memory with cgo off, because it needs no Rust toolchain and is plenty for a single small project. To switch to the production mode, build the oxc shim in once and flip two env vars:
# one-time: compile the Rust parser shim, then build with cgo + the oxc tag
#   scripts/build-oxc-shim.sh && go build -tags oxc ./...

SYMBOLICATOR_PARSER=oxc
SOURCEMAP_CACHE_TYPE=disk
SOURCEMAP_DISK_CACHE_PATH=/var/lib/tracepath/twcache
SOURCEMAP_DISK_CACHE_MAX_MB=2048
The same trick, every language
Nothing in Stage 2 or Stage 3 was about JavaScript. The .tw format is a sorted token table plus two string tables. It doesn't care whether those tokens came from a JavaScript source map, a Dart .symbols file, or an iOS .dSYM. Those last two are the debug files mobile platforms ship instead of source maps, both built on DWARF (the same debug format a native debugger reads). Every one of them gets flattened into the same .tw on a cache miss, and from there it's the same binary search over the same mmap'd bytes. So the disk tier (survival, flat memory, a cache that outlives a restart) comes for free the moment you teach the symbolicator a new format.
The benchmark bears that out. Dart first (no Honeycomb column, since their processor doesn't support Dart or Flutter):
| impl | scenario | max stacks/s | p99 ms | peak RSS MB | outcome |
|---|---|---|---|---|---|
| tracepath-dart-disk | hot | 24,304 | 425.9 | 137 | survived |
| tracepath-dart-disk | churn | 22,915 | 398.5 | 138 | survived |
| tracepath-dart-mem | hot | 28,605 | 5.5 | 361 | survived |
| tracepath-dart-mem | churn | 8,586 | 72.7 | 529 | survived |
The same pattern holds. disk wins churn throughput 2.7× and holds memory at 138 MB against mem's 529 MB (and 2,165 MB on the oom soak). mem is much faster on the always-warm hot path (a 5.5 ms p99, where disk's tail runs far longer), but hot is the one scenario that never happens at scale. The flatten-once, mmap-forever pattern does the identical job for DWARF that it did for source maps.
And iOS, head-to-head with Honeycomb's dsymprocessor:
| impl | scenario | max stacks/s | p99 ms | peak RSS MB | outcome |
|---|---|---|---|---|---|
| honeycomb-ios | churn | 11,433 | 285 | 9,727 | survived |
| tracepath-ios-disk | churn | 46,174 | 303 | 94 | survived |
| tracepath-ios-mem | churn | 29,275 | 13.3 | 275 | survived |
tracepath-ios-disk pushes ~4× the throughput of honeycomb-ios at 94 MB against Honeycomb's 9,727 MB, about 100× less memory. Honeycomb keeps each parsed symbolic archive resident. TracePath keeps a compact .tw and lets the kernel page it. Different binary format, same win. I didn't write a line of new cache code to get it.
Conclusion
A symbolicator is the least glamorous corner of an observability platform, and I sank weeks into it anyway, decoding source maps and DWARF by hand. "Close enough" symbolication is what fails you at 3 a.m., when a frame says n and you need validateCheckout. Getting that boring layer right is why I'm building TracePath from the ground up instead of renting it.
The part I'd underrated going in was mmap. I'd read about it for years and never reached for it in production until this one. You hand the kernel a file, get back a byte array that is the file, and the OS page cache does the eviction for you. The fallback, os.ReadFile, just copies every byte onto the heap for the garbage collector to chase. Handing the cache to the operating system, instead of writing a worse one, is the thing I'll reach for first next time.
The format is done and it's what ships today, but one idea keeps tugging at me for a future version, just because it'd be fun to chase. Every token is a full 24 bytes of absolute values, so a lookup scatters across the file even though mmap already hands back a whole 4 to 16 KB page each time it faults. Frame-of-reference encoding could tighten that: group the tokens into fixed-length frames, keep one base per frame, and store each token as a tiny delta from it. The file would shrink, and a lookup would stay inside a single frame, one page fault instead of a dozen. I have no idea yet how much it actually buys, which is exactly the kind of thing I'd love to find out.
TracePath is MIT-licensed and OpenTelemetry-native, and the symbolicator above ships with it: the .tw format, the mmap cache, all of it. The algorithm half of this story is in the source map deep dive and the Flutter one. This was the systems half. Ever made something faster on disk than in memory because the on-disk shape was the right shape? I'd love to hear it. Reach me at [email protected].